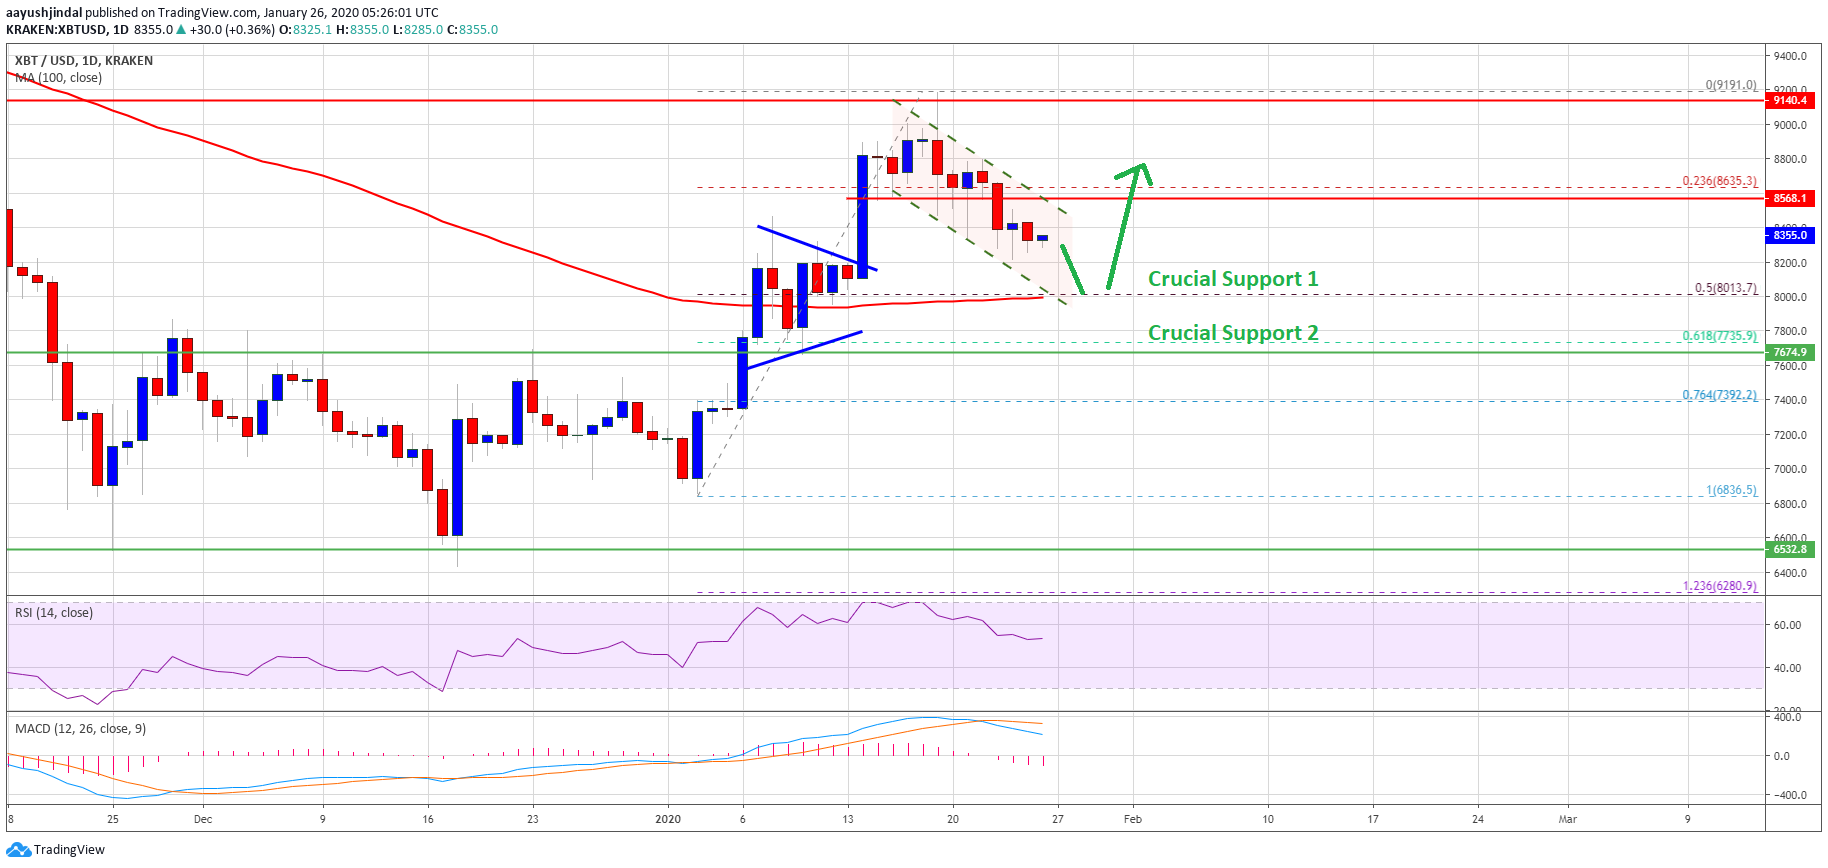
Bitcoin started a downside correction from the 2020 high at $9,191 against the US Dollar. However, BTC price is still in an uptrend and it could find buyers near $8,000 or $7,670.
- Bitcoin price started a short term downside correction below $9,000 and $8,800.
- It is currently trading above $8,200 and there are many important supports on downside.
- There is a declining channel or a bullish flag forming with resistance near $8,500 on the daily chart of the BTC/USD pair (data feed from Kraken).
- The pair is likely to find a strong buying interest near $8,000 and the 100-day simple moving average.
Bitcoin Price Remains Supported On Dips
After forming a short term top near the $9,191 level, bitcoin started a downside correction. BTC price broke the $9,000 and $8,800 levels to enter a bearish zone.
The bears were able to push the price below the 23.6% Fib retracement level of the last important rise from the $6,836 low to $9,191 high. Moreover, there was a daily close below the $8,500 support level.
Though, there are many important supports on the downside near the $8,200 and $8,000 levels. The main support is near the $8,000 level since it is close to the 100-day simple moving average.
Besides, the 50% Fib retracement level of the last important rise from the $6,836 low to $9,191 high is also near the $8,000 level. Therefore, dips remain supported on the downside if the price corrects further.
On the upside, the $8,500 zone is a major hurdle for the bulls. There is also a declining channel or bullish flag forming with resistance near $8,500 on the daily chart of the BTC/USD pair.
Therefore, bitcoin needs to climb above the $8,500 and $8,540 resistance levels to start a fresh increase. Furthermore, a successful close above $8,600 might lead the price towards $9,000 and $9,200.
Chances of Major Drop in BTC?
As stated, the $8,000 support is a major buy zone. If there is a downside break below $8,000, the next major support is near the $7,670 area.
The previous breakout zone was near $7,670 and now it coincides with the 61.8% Fib retracement level of the last important rise from the $6,836 low to $9,191 high.
Thus, a successful daily close below $7,670 or $7,600 could negate the current bullish view. In the mentioned case, the price is likely to revisit the $6,500 support area.
Technical indicators:
Daily MACD – The MACD is slowly gaining momentum in the bearish zone.
Daily RSI (Relative Strength Index) – The RSI for BTC/USD is still above the 50 level.
Major Support Levels – $8,200 followed by $8,000.
Major Resistance Levels – $8,500, $8,550 and $9,200.


