
Ethereum is down more than 10% from the 2020 high against the US Dollar, similar to bitcoin. ETH price is likely to test the $148 support area before a fresh increase.
- ETH price is currently correcting lower from the $179 swing high against the US Dollar.
- The price is showing a few bearish signs and it might decline below the $158 support.
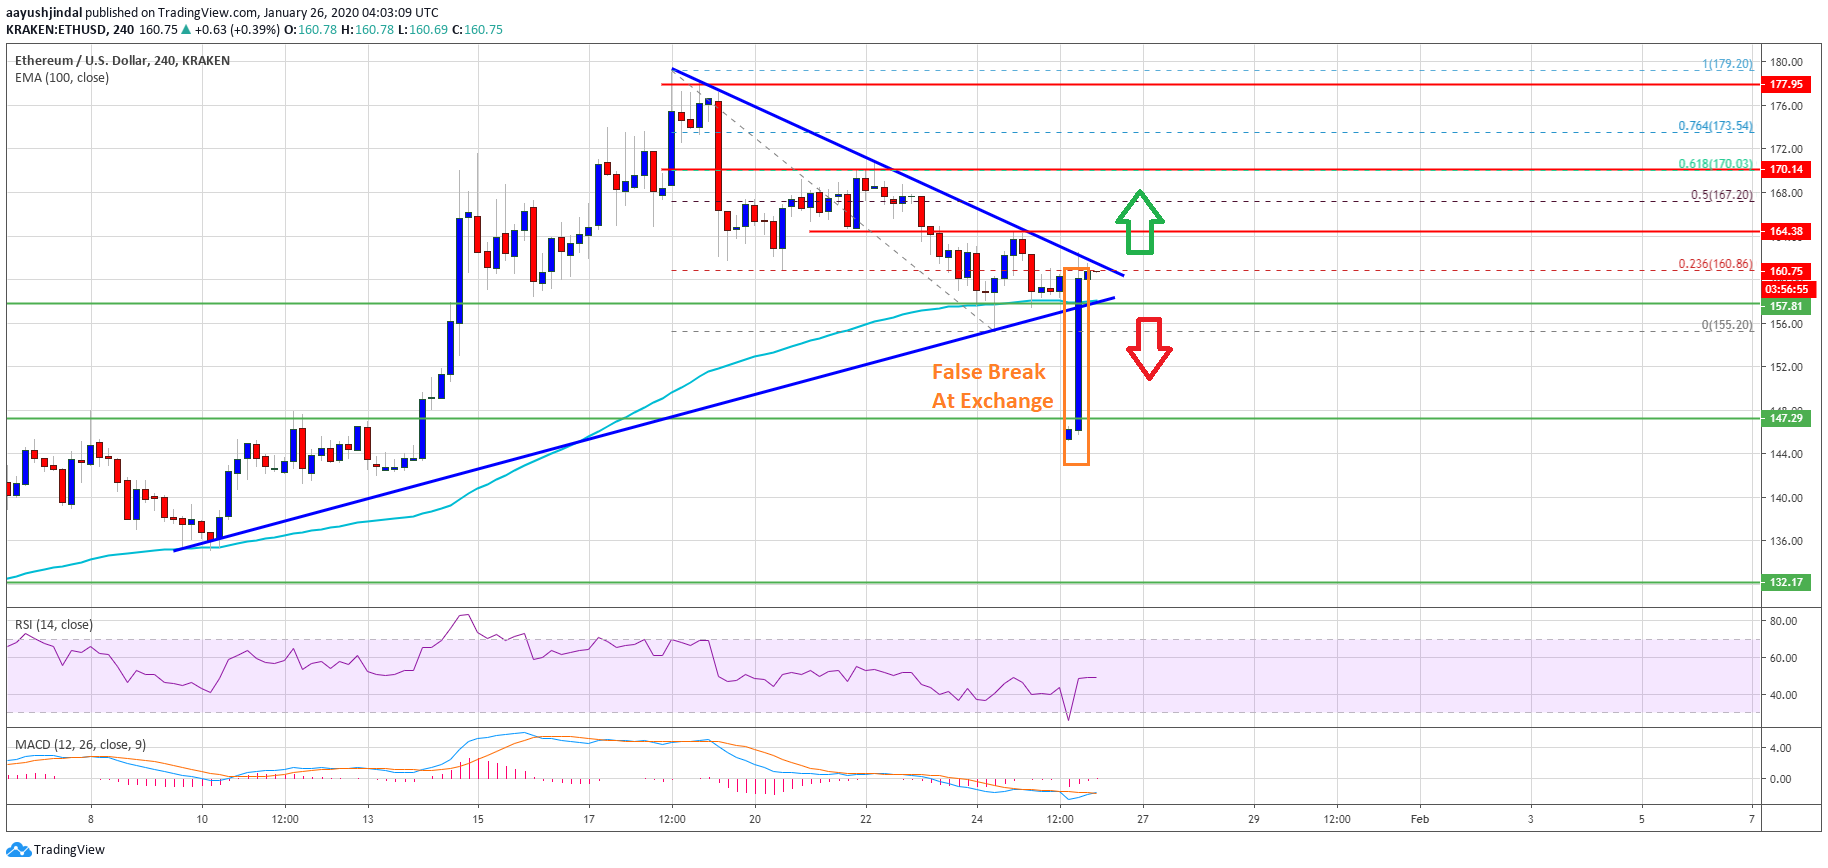
- There is a major contracting triangle forming with support near $158 on the 4-hours chart of ETH/USD (data feed via Kraken).
- The pair could either rally again above $165 or it might extend its decline towards $148.
Ethereum Price Could Correct Further
This past week, both bitcoin and Ethereum started a downside correction from well above $170 and $8,500 respectively against the US Dollar. ETH price formed a short term top near the $179 level and corrected below the $170 support area.
Moreover, there was a close below the $165 support area. However, the bulls were able to protect the key $158 support area and the 100 simple moving average (4-hours).
The price traded as low as $156 and it is currently trading in a range. It is testing the 23.6% Fib retracement level of the corrective was from the $179 high to $156 low. More importantly, there is a major contracting triangle forming with support near $158 on the 4-hours chart of ETH/USD.
Ethereum Price
Therefore, a downside break below the key $158 support area and the 100 simple moving average (4-hours) could start a downside extension. In the mentioned case, Ethereum price is likely to dip towards the $150 level.
The main support is near the $148 level, where the current correction from $179 might end and the bulls could take a stand for a fresh increase.
What’s Bullish for ETH?
If ETH bulls are able to protect the $158 support and the 100 simple moving average (4-hours), there are chances of a fresh increase. On the upside, a clear break above the triangle resistance near $162 might start an upward move.
The first hurdle is near the $168 level since it is near the 50% Fib retracement level of the corrective was from the $179 high to $156 low. The main resistance is near the $170 level, above which Ethereum is likely to surge towards the $180 resistance in the near term.
Technical Indicators
4 hours MACD – The MACD for ETH/USD is losing momentum in the bearish zone.
4 hours RSI – The RSI for ETH/USD is currently near the 55 level.
Major Support Level – $158
Major Resistance Level – $170


