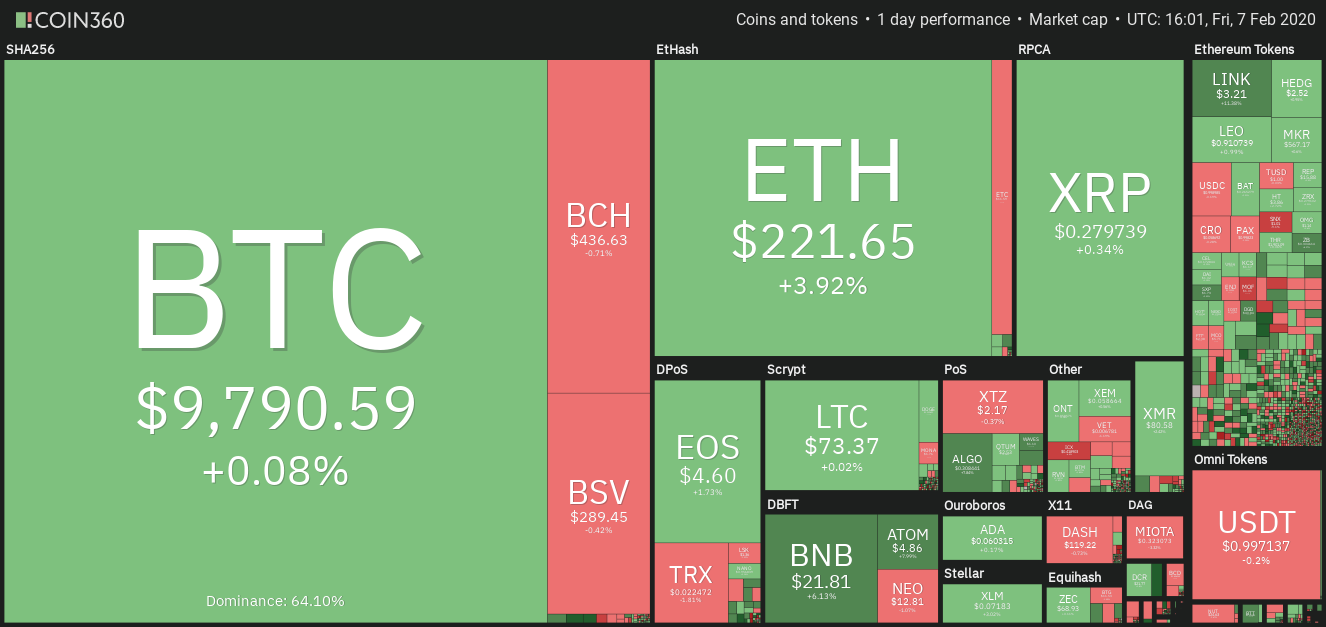
Most major cryptocurrencies are nearing stiff resistance levels, which can result in a few days of consolidation or a minor correction.
The institutional investors have maintained their bullish stance on Bitcoin. Though the spot price is yet to hit $10,000, CME Bitcoin futures have already reached the five-figure mark. Additionally, the Bitcoin futures open interest on BitMEX has topped $1.5 billion. This shows that the institutional traders expect the rally to extend further.
Morgan Creek Digital Co-Founder Anthony Pompliano meanwhile has said that his idea of Bitcoin acting as a hedge for portfolios due to its non-correlated nature has only solidified over time.
He added that Bitcoin moved in the opposite direction to both the S&P 500 index and gold in May 2019 during the trade war. This shows that Bitcoin can add a layer of protection to the portfolio, which no other asset class can do.
Daily cryptocurrency market performance. Source: Coin360
Governors of six major central banks will discuss joint research on central bank digital currencies when they meet for an International Monetary Fund conference in April.
Japan’s former economy minister Akira Amari wants the “United States to set (digital currency) on the G7 agenda as chair.” Amari is concerned about the possible struggle for currency supremacy should China launch a digital yuan.
Though Bitcoin has risen about 35% year-to-date, its dominance continues to dip, though the total crypto market capitalization is attempting to hit the $300 billion mark. This shows that the “altseason” narrative is still in play.
BTC/USD
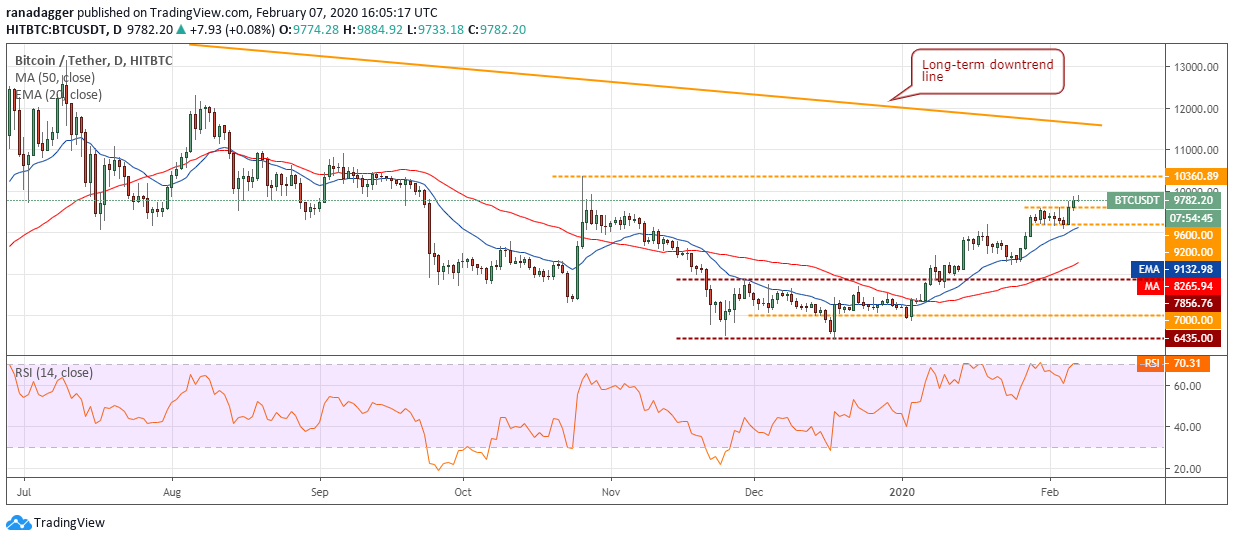
Bitcoin (BTC) has been trading above $9,600 for the past two days, which is a bullish sign. There is a psychological resistance at $10,000 but we expect it to be crossed. The next target to watch on the upside is $10,360.89.
BTC USD daily chart. Source: Tradingview
We anticipate the bears to mount a stiff resistance at $10,360.89. Therefore, short-term traders can watch this level closely and book partial profit if the bulls struggle to scale the price above it.
However, if the bulls can push the price above $10,360.89, the BTC/USD pair is likely to move up to the long-term downtrend line at $11,500. Both moving averages are sloping up and the RSI is close to the overbought territory, which suggests that bulls are in command. The traders can trail the stops on the long positions to $8,900.
Our bullish view will be invalidated if the pair breaks the series of higher highs and higher lows it has been making since bottoming out in December of last year. The first sign of weakness will be a break below the recent low of $9,097.15.
ETH/USD
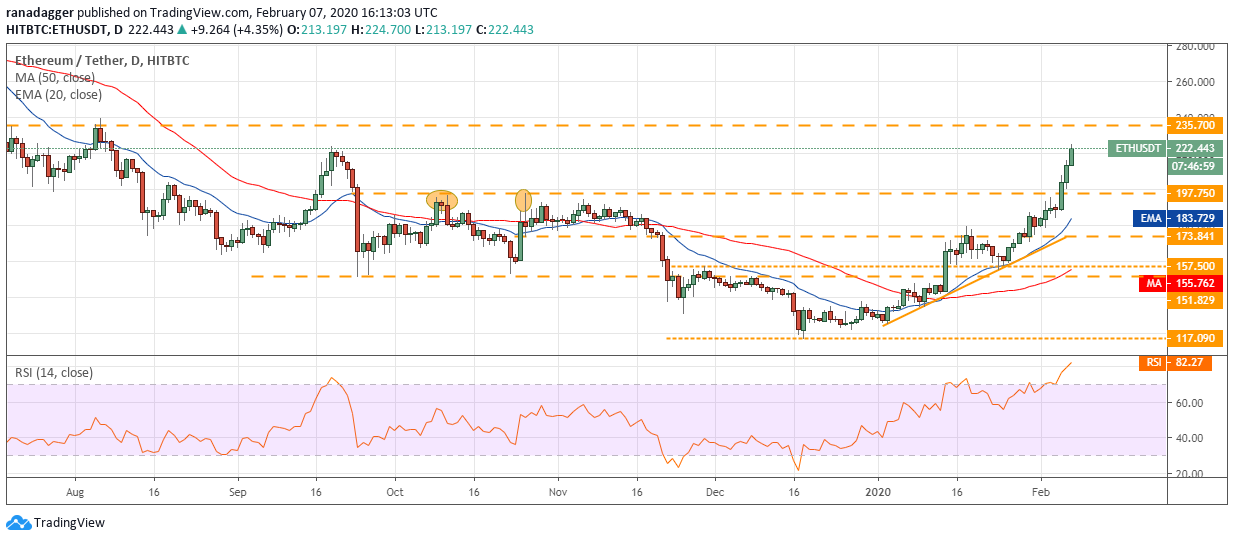
Ether (ETH) picked up momentum after sustaining above $197.75 on Feb. 5. The sharp rally of the past three days carried the price above the overhead resistance at $223.999, which is a positive sign. If the price can sustain above $223.999, a move to $235.70 is possible.
ETH USD daily chart. Source: Tradingview
We expect the bears to mount a stiff resistance in the $223.999-$235.70 range. The overbought reading on the RSI also suggests a few days of consolidation or a minor correction. Therefore, the traders can book partial profits in this range and tighten the stops on the remaining long positions to $190.
We anticipate the bulls to buy the next dip to $197.75. A bounce of this level will increase the possibility of a break above $235.70 but if the level cracks, the ETH/USD pair can dip to the 20-day EMA at $183.72.
XRP/USD
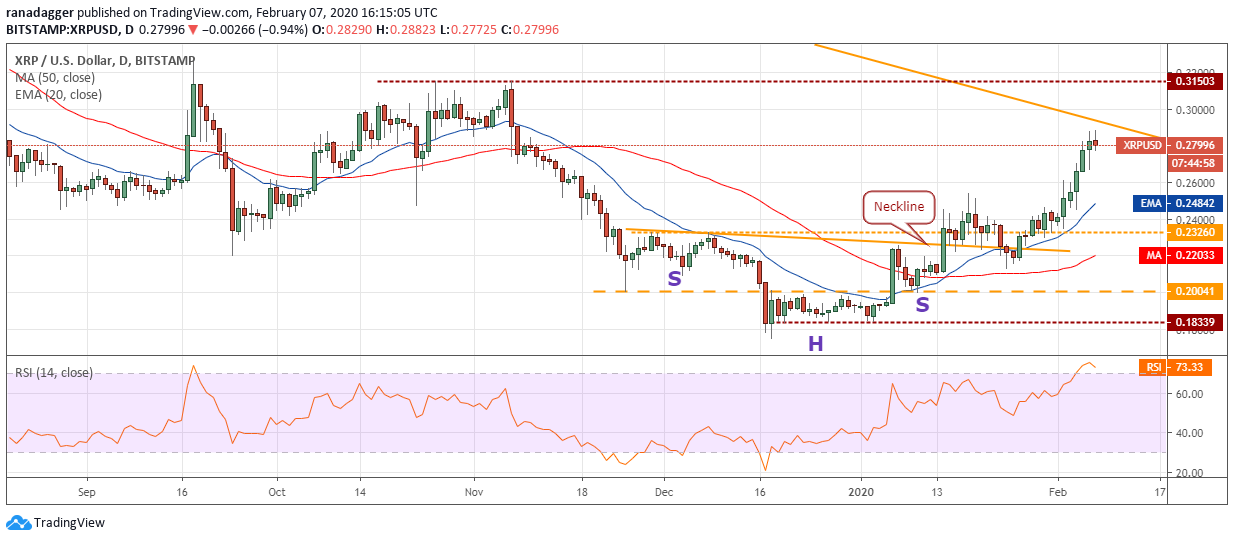
XRP crossed $0.28132 on Feb. 5, which was the minimum target objective of the inverted head and shoulders bottom. The bulls might face some resistance at the long-term downtrend line, which is just above the current levels.
XRP USD daily chart. Source: Tradingview
The RSI is in the overbought territory, which also suggests a correction might be around the corner. A dip from the current levels is likely to find support at the 20-day EMA at $0.25. A break below the 20-day EMA will signal weakness.
Conversely, if the bulls can push the price above the downtrend line, a rally to $0.31503 and above it to $0.34229 is possible. The traders can trail the stops on the long positions to just below the 20-day EMA at $0.245.
BCH/USD
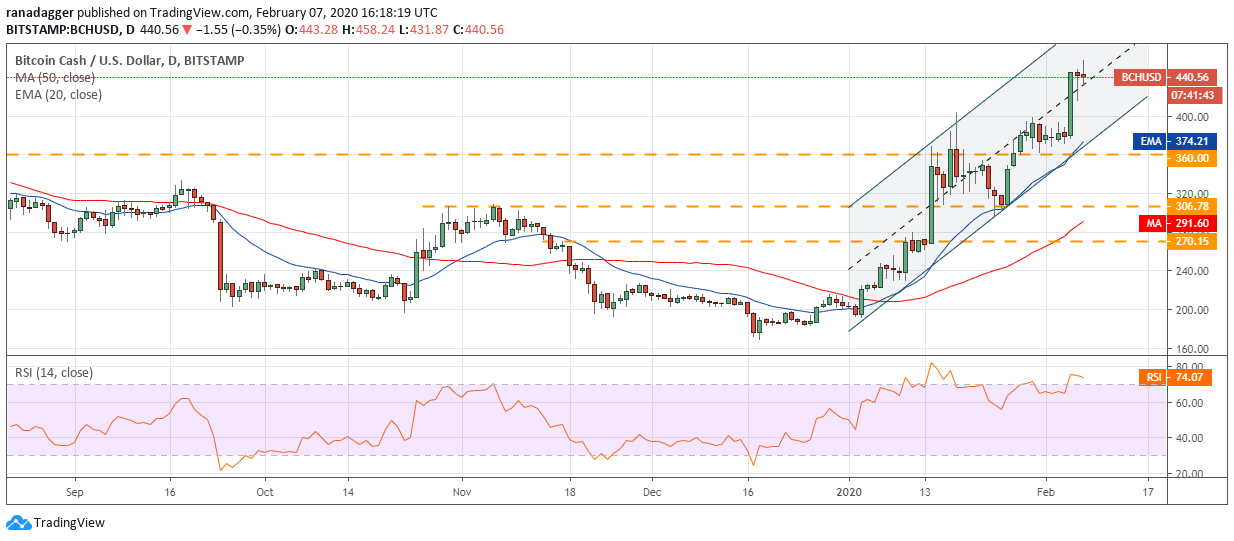
Bitcoin Cash (BCH) soared to our first target objective of $440 on Feb. 5. The bears are currently defending this level but if the bulls can push the price and sustain above it, a move to $500 is possible.
BCH USD daily chart. Source: Tradingview
Though the bulls are in command, the RSI has risen into overbought territory, which suggests a minor consolidation or correction for a few days.
Any dip from the current levels is likely to find support at the 20-day EMA at $374. If the price bounces off this support, the bulls will again attempt to resume the up move. A break below $360 will turn the trend in favor of the bears.
BSV/USD
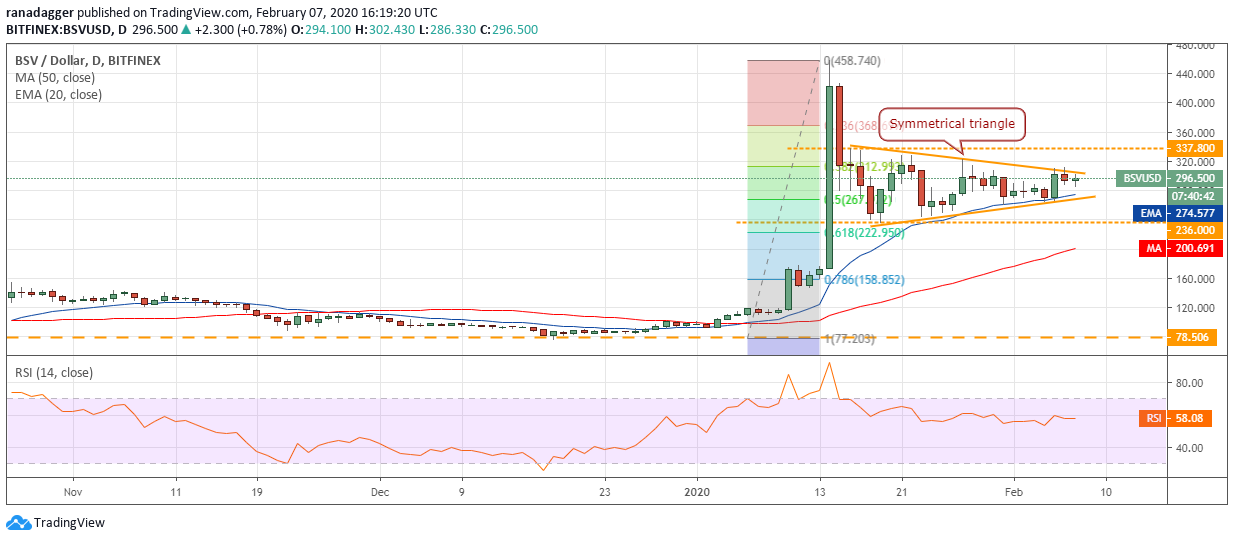
The bulls have not been able to sustain Bitcoin SV (BSV) above the resistance line of the triangle in the past two days. This shows a lack of buyers at higher levels. The bears will now try to drag the price to the support line of the triangle.
BSV USD daily chart. Source: Tradingview
The range in the BSV/USD pair has tightened in the past few days. Usually, such price action is followed by a sharp move. However, it is difficult to predict the direction of the breakout.
If the price breaks out to the upside, $337.80 might offer some resistance above which, a retest of the lifetime highs is likely. Conversely, if the price breaks below the triangle, a dip to $236 and below it to $158.852 is possible.
LTC/USD
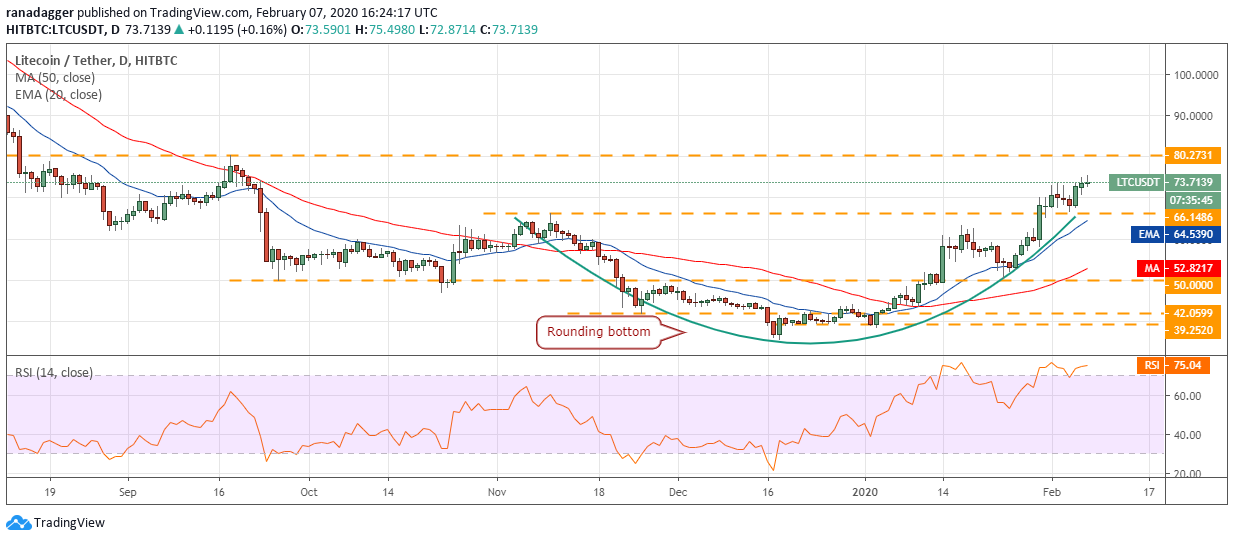
Though Litecoin (LTC) broke above the minor resistance at $73.5259, it has not been able to pick up momentum. This shows that the bulls are tiring out and a few days of range-bound action is possible.
LTC USD daily chart. Source: Tradingview
The LTC/USD pair might consolidate between $80.2731 and $66.1486 for the next few days. On a close (UTC time) above $80.2731, a move to $96.439 will be on the cards. We might suggest long positions on the next dip to $66.1486.
However, if the bears sink the price below the critical support at $66.1486, the pair will lose momentum and can extend its decline.
EOS/USD
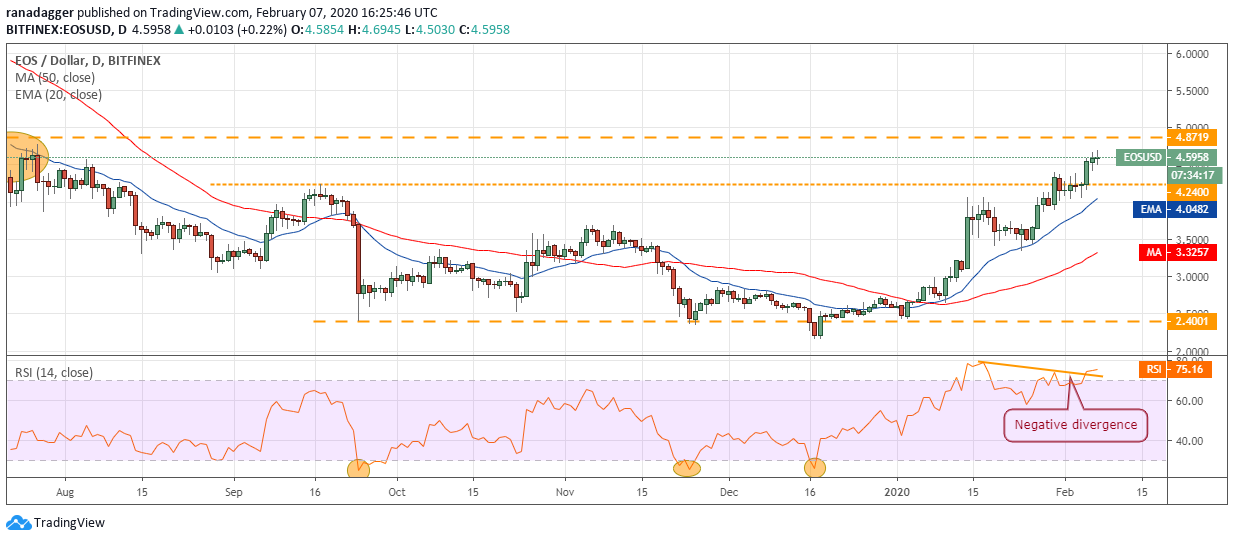
The bulls are finding it difficult to carry EOS to the overhead resistance at $4.8719. This shows a lack of buyers at higher levels. The altcoin might now dip to the $4.24 to $4.0 support zone.
EOS USD daily chart. Source: Tradingview
If the price bounces off the support zone, it will indicate aggressive buying by the bulls. This will increase the possibility of a breakout above $4.8719. Above this level, the EOS/USD can rally to $6.
Conversely, if the bears sink the price below $4, the pair might lose momentum and drop to the next support at $3.3555.
BNB/USD
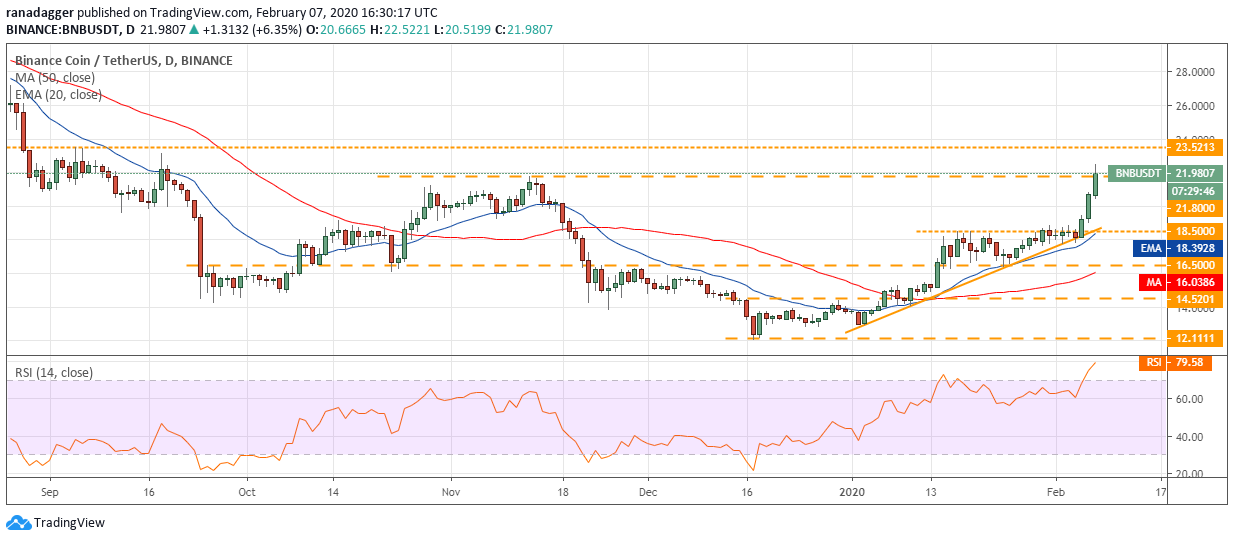
Binance Coin (BNB) picked up momentum after breaking out of $19 levels on Feb. 5. The bulls are currently attempting to sustain the price above the overhead resistance at $21.80. If successful, the next level to watch out for is $23.5213.
BNB USD daily chart. Source: Tradingview
We expect the bears to defend the $21.80 to $23.5213 zone aggressively. If the bulls struggle to push the price above $23.5213, the traders might book partial profits.
However, if the momentum can carry the price above $23.5213, a rally to $27 is possible. The traders can trail the stops on the long positions to $18. Our bullish view will be invalidated if the BNB/USD pair reverses direction sharply and breaks below $18.50.
ADA/USD
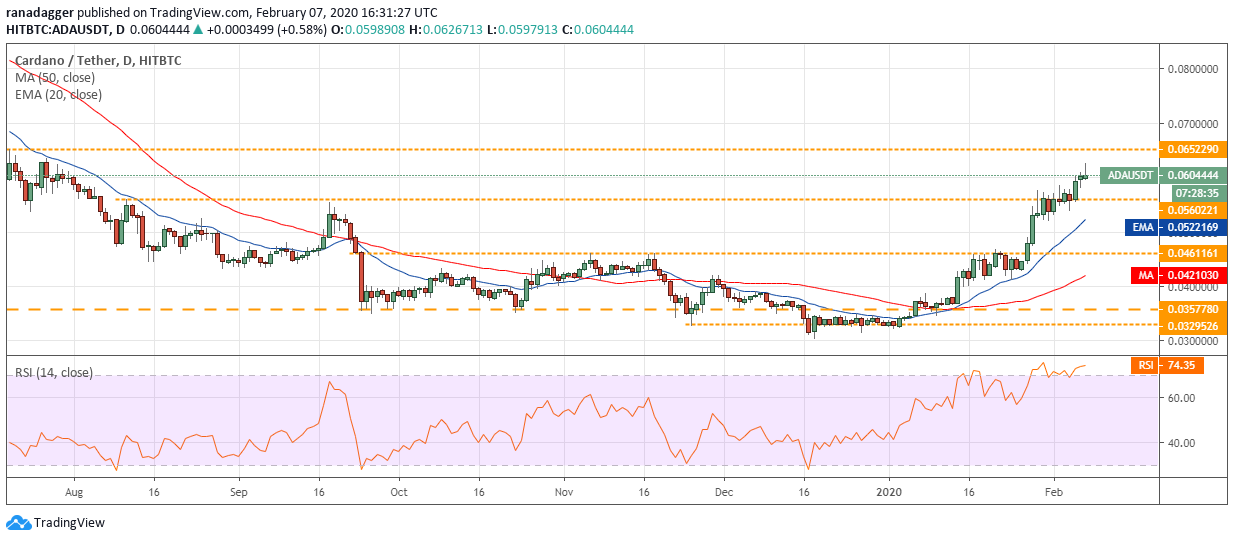
The bears are attempting to defend the overhead resistance at $0.065229. They will now try to drag Cardano (ADA) to the support at $0.0560221. If the support holds, the price might remain range-bound for a few days.
ADA USD daily chart. Source: Tradingview
If the bulls can push the price above $0.065229, the ADA/USD pair can extend its rally to $0.08. Conversely, the pair will lose momentum if the bears sink the price back below the 20-day EMA at $0.0522. The traders can trail the stop-loss on the remaining long positions to $0.054.
XTZ/USD
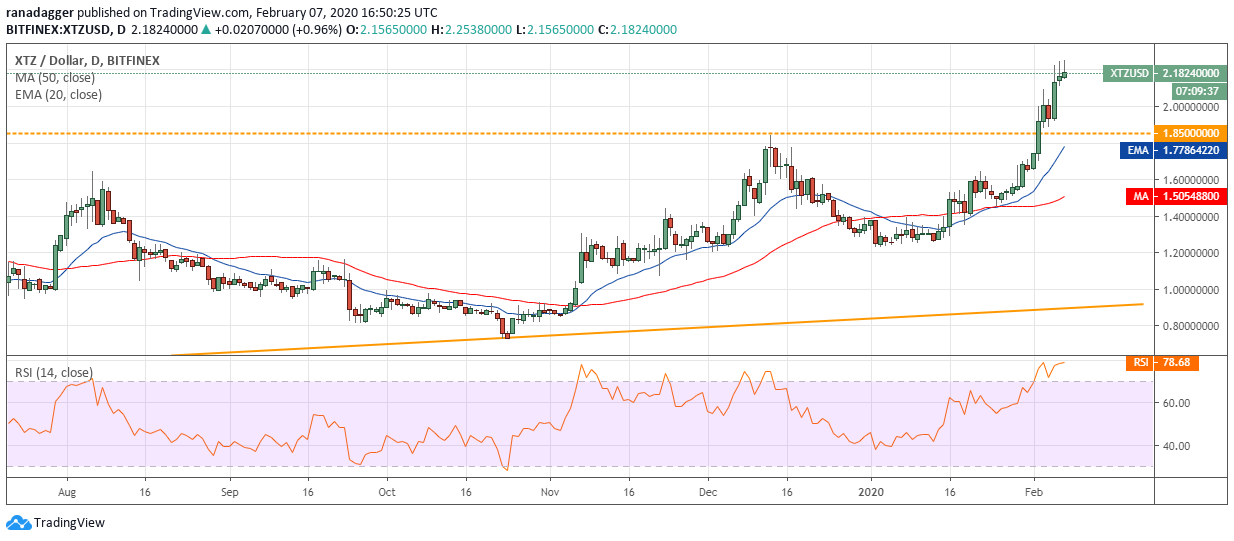
Tezos (XTZ) is facing resistance close to the $2.50 mark as suggested in our previous analysis. The RSI has risen into the bought territory, which suggests that a pullback or a consolidation is likely.
XTZ USD daily chart. Source: Tradingview
If the price turns down from the current levels, it is likely to find support at the breakout level of $1.85. A strong rebound off this support will increase the possibility of a breakout of $2.50. Above this level, the rally can extend to $2.90 and above it to $3.35.
Contrary to our assumption, if the bears sink the price below the critical support at $1.85, the XTZ/USD pair will turn negative.
The views and opinions expressed here are solely those of the author and do not necessarily reflect the views of CryptoX. Every investment and trading move involves risk. You should conduct your own research when making a decision.
Market data is provided by HitBTC exchange.


