The bulls are aggressively defending the 20-day EMA in Bitcoin and select altcoins, which could result in the resumption of the uptrend.
The coronavirus pandemic has forced people to change several social behavioral habits. Along with maintaining social distance from one another, people are also averse to using notes, coins or cards as they might transmit COVID-19.
A new report from the Bank for International Settlements suggested that social distancing procedures and the “government-to-person payment schemes” have accelerated the efforts towards launching central bank digital currencies (CBDCs). The paper shows that the public interest in CBDCs has exceeded that of Bitcoin (BTC) and Libra in 2020.
However, the CBDCs will only be a digital version of the fiat currencies that will be controlled by the central banks. Hence, the problems that plague the U.S. dollar currently will even affect the digital version of the dollar.
Therefore, after people familiarize with CBDCs and realize their ease of use, they are likely to warm up to cryptocurrencies due to their inherent advantages over fiat currencies.
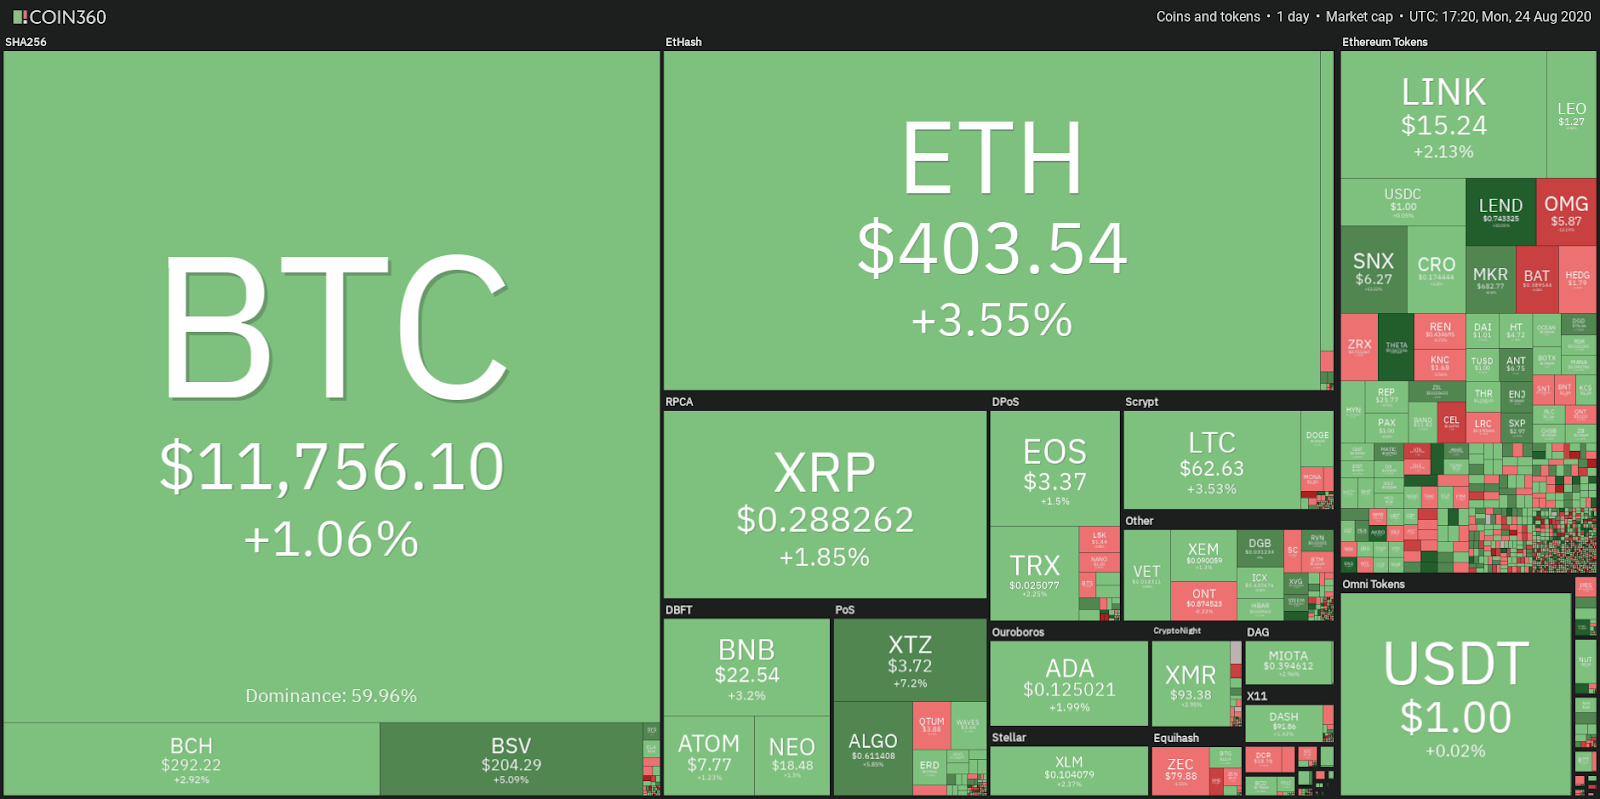
Daily cryptocurrency market performance. Source: Coin360
Even with its numerous advantages, Bitcoin continues to have its naysayers. Ryanair CEO Micheal O’Leary painted a very bearish picture of Bitcoin and said it was “equivalent to a Ponzi scheme”. This shows how several institutional investors are still wary of cryptocurrencies but retail traders have been quick to embrace the new asset class.
BTC/USD
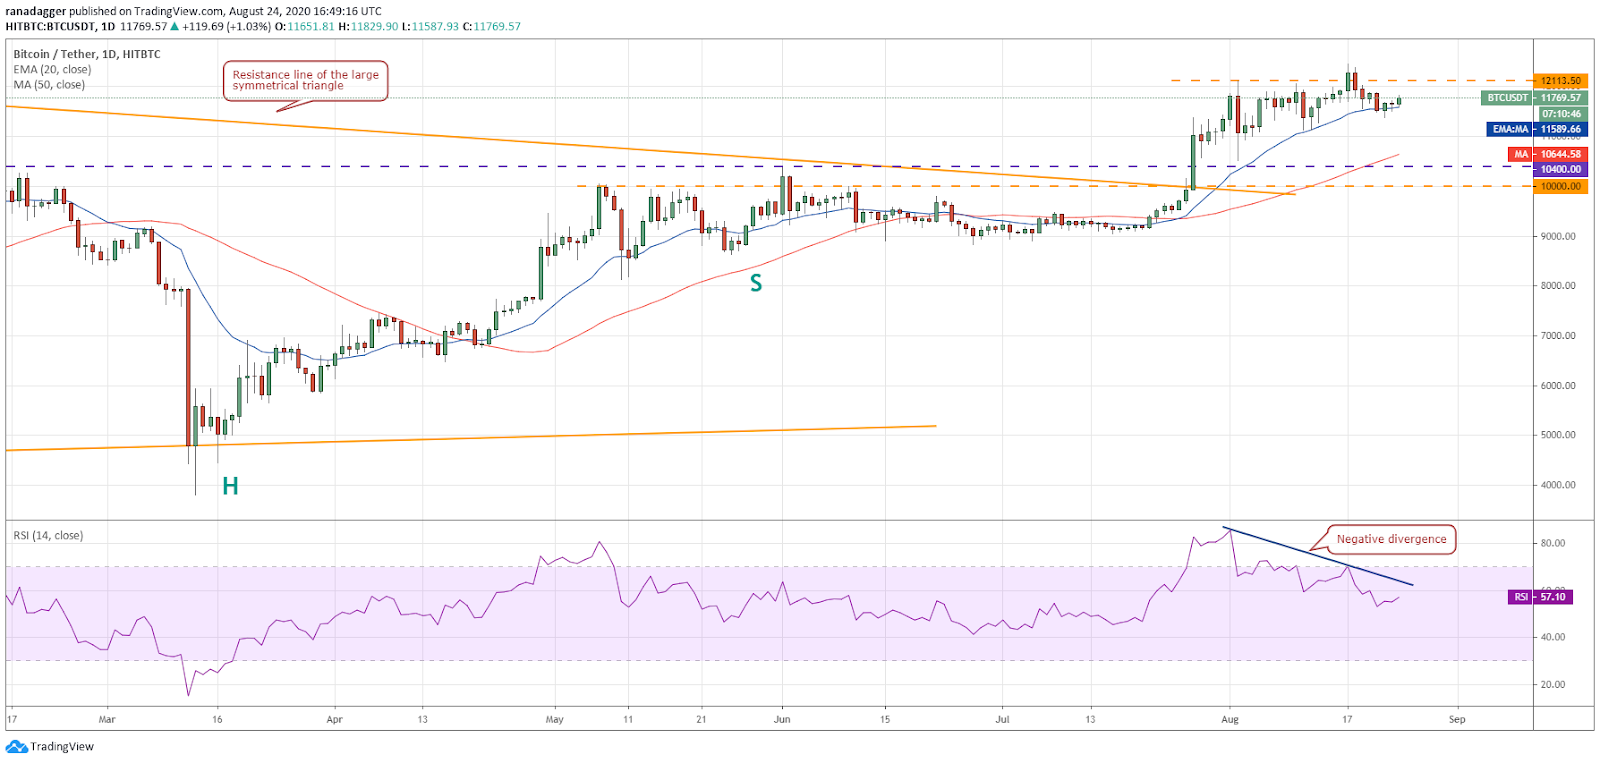
The bulls are defending the 20-day exponential moving average ($11,589), which is a positive sign as it indicates that the sentiment remains bullish. Bitcoin could now move up to the $12,113.50 resistance.
BTC/USD daily chart. Source: TradingView
The 20-day EMA is gradually sloping up and the relative strength index is in the positive zone, which suggests that the path of least resistance is to the upside.
If the bulls can propel the price above the $12,113.50–$12,460 resistance zone, the uptrend is likely to resume with the next target at $13,000 and then $14,000.
However, the bulls are unlikely to give up without a fight. They will again mount a stiff resistance at $12,113.50. If the BTC/USD pair turns down from this zone, a drop to $11,000 and then to $10,400 is possible.
ETH/USD
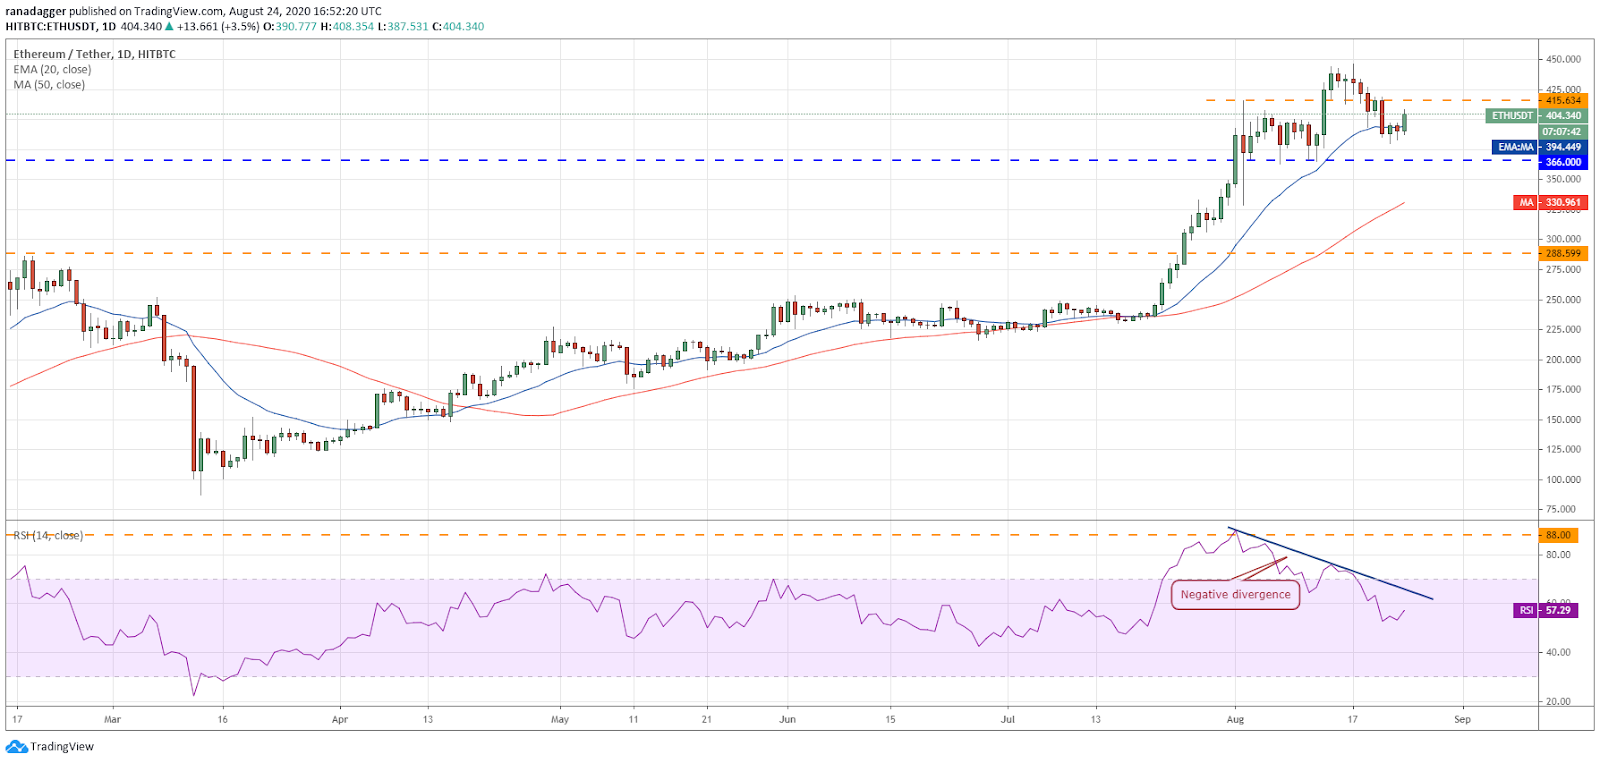
Ether (ETH) repeatedly slipped below the 20-day EMA ($394) for three consecutive days between Aug. 21 to 23 but the bears could not intensify the selling and pull the price down to $366, which suggests that the bulls were accumulating at lower levels.
ETH/USD daily chart. Source: TradingView
Currently, the bulls are attempting to push the ETH/USD pair above the $415.634 resistance. If they succeed, a retest of $446.479 is likely. A breakout of this level will signal the possible resumption of the uptrend, with the next target objective at $480 and then $516.11.
However, if the pair turns down from either $415.634 or $446.479, a few days of range-bound action is possible.
The flat 20-day EMA and the RSI just above the midpoint also suggests a consolidation for a few days. The trend will turn negative if the bears sink the price below the critical support at $366.
XRP/USD
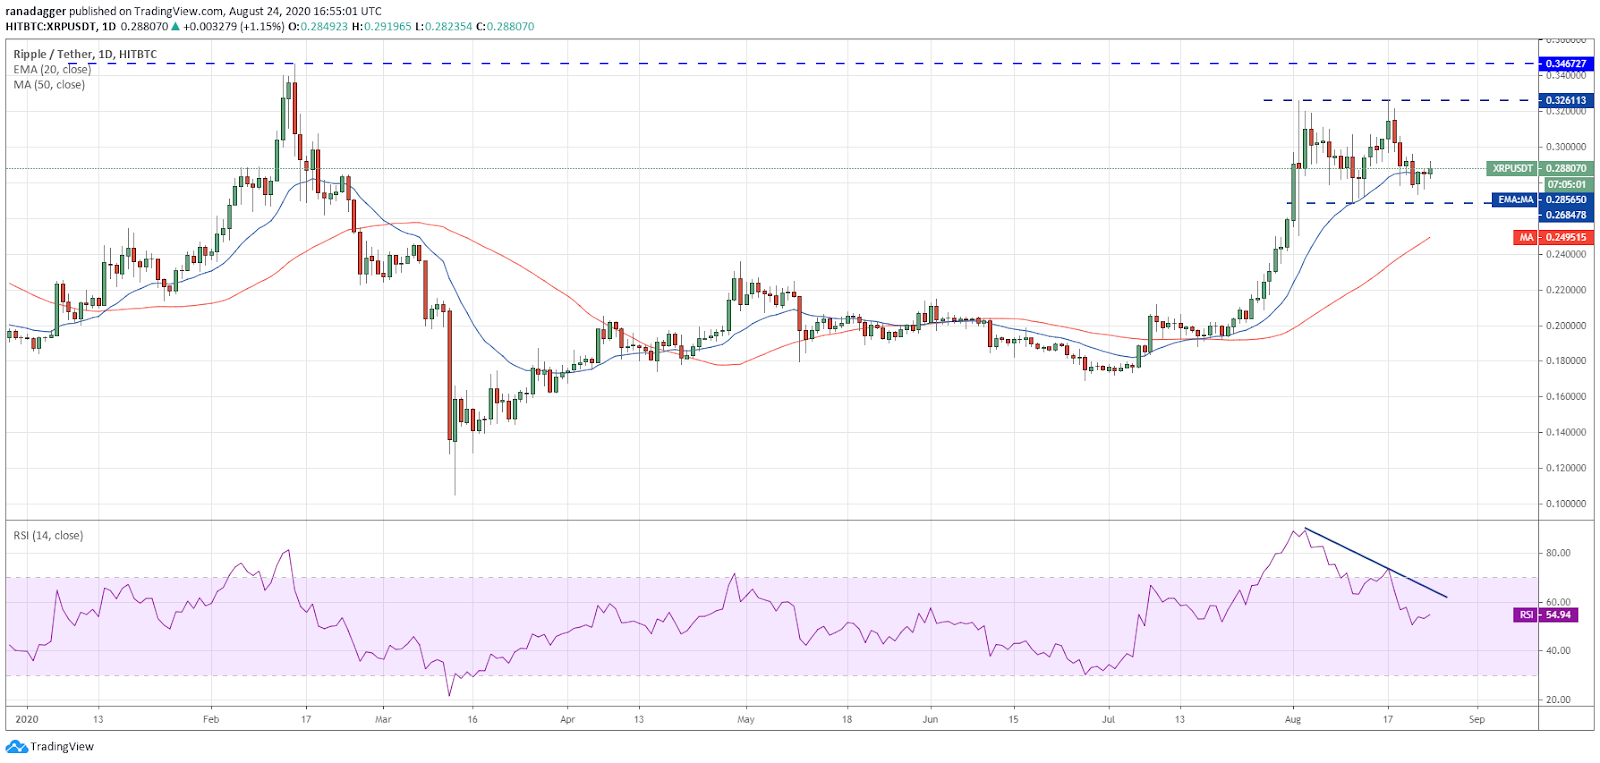
XRP is currently range-bound between $0.326113 and $0.268478. The 20-day EMA ($0.285) has flattened out and the RSI is just above the midpoint, which suggests a balance between demand and supply.
XRP/USD daily chart. Source: TradingView
This balance will shift in favor of the bulls if they can push the price above $0.326113. Above this level, a rally to $0.346727 and then to $0.40 is possible.
However, if the pair turns down from $0.326113, it will extend its stay inside the range for a few more days.
The advantage will shift in favor of the bears if the XRP/USD pair breaks below the $0.268478 support. If this level cracks, a drop to $0.24 is likely.
BCH/USD
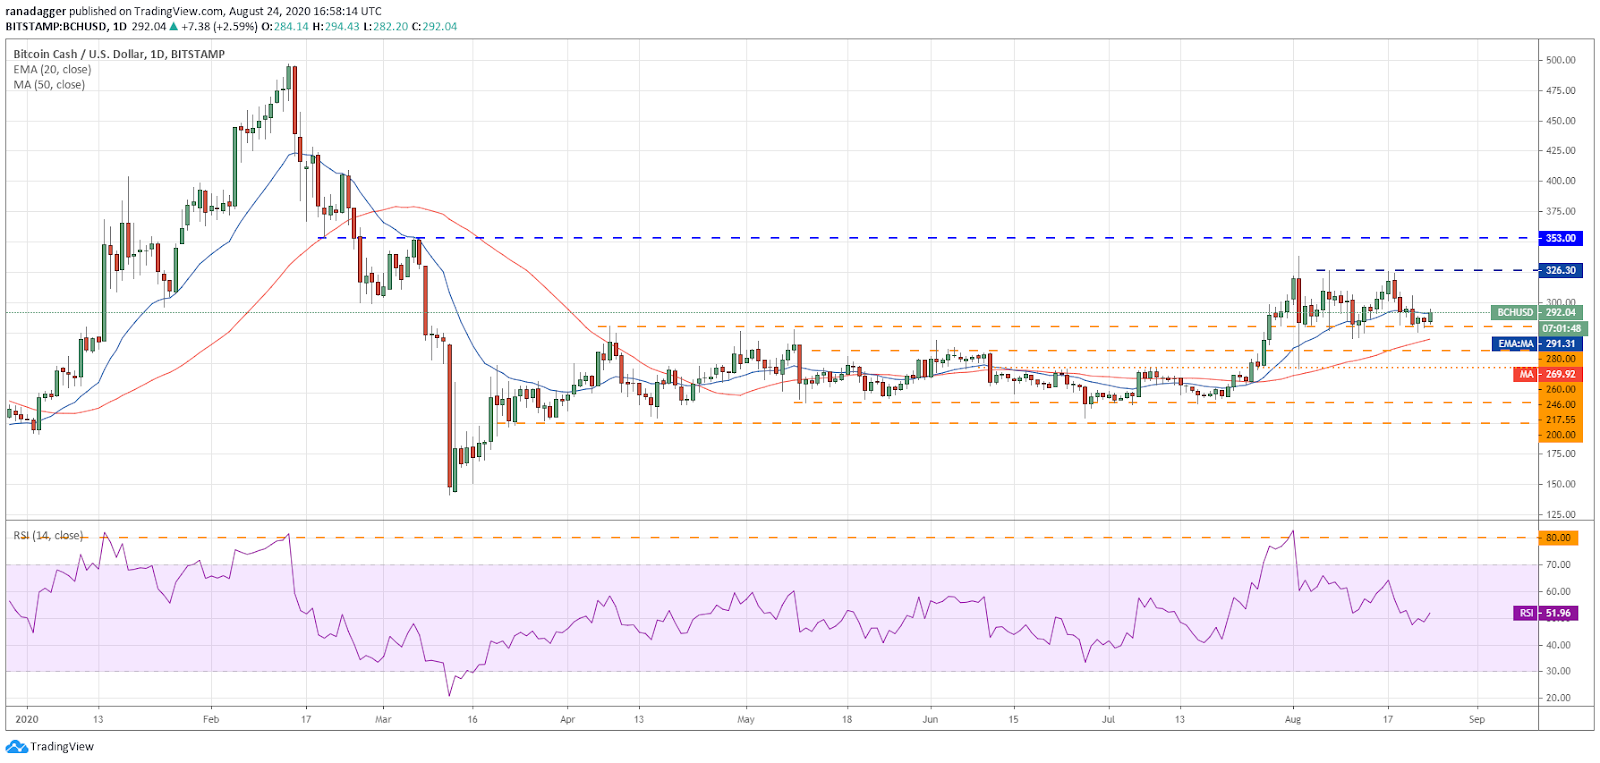
The bulls have managed to defend the breakout level of $280, which suggests buying on dips. They will now try to push Bitcoin Cash (BCH) to the overhead resistance at $326.30. The bears are likely to defend this level aggressively.
BCH/USD daily chart. Source: TradingView
If the price turns down from $326.30, the BCH/USD pair could remain range-bound for a few more days.
However, if the bulls can push the price above $326.30, a rally to $353 is possible. A breakout of this resistance could result in a rally to $400.
This view will be invalidated if the pair breaks and sustains below the $280 support. The next target on the downside is $260 and then $245.
LINK/USD
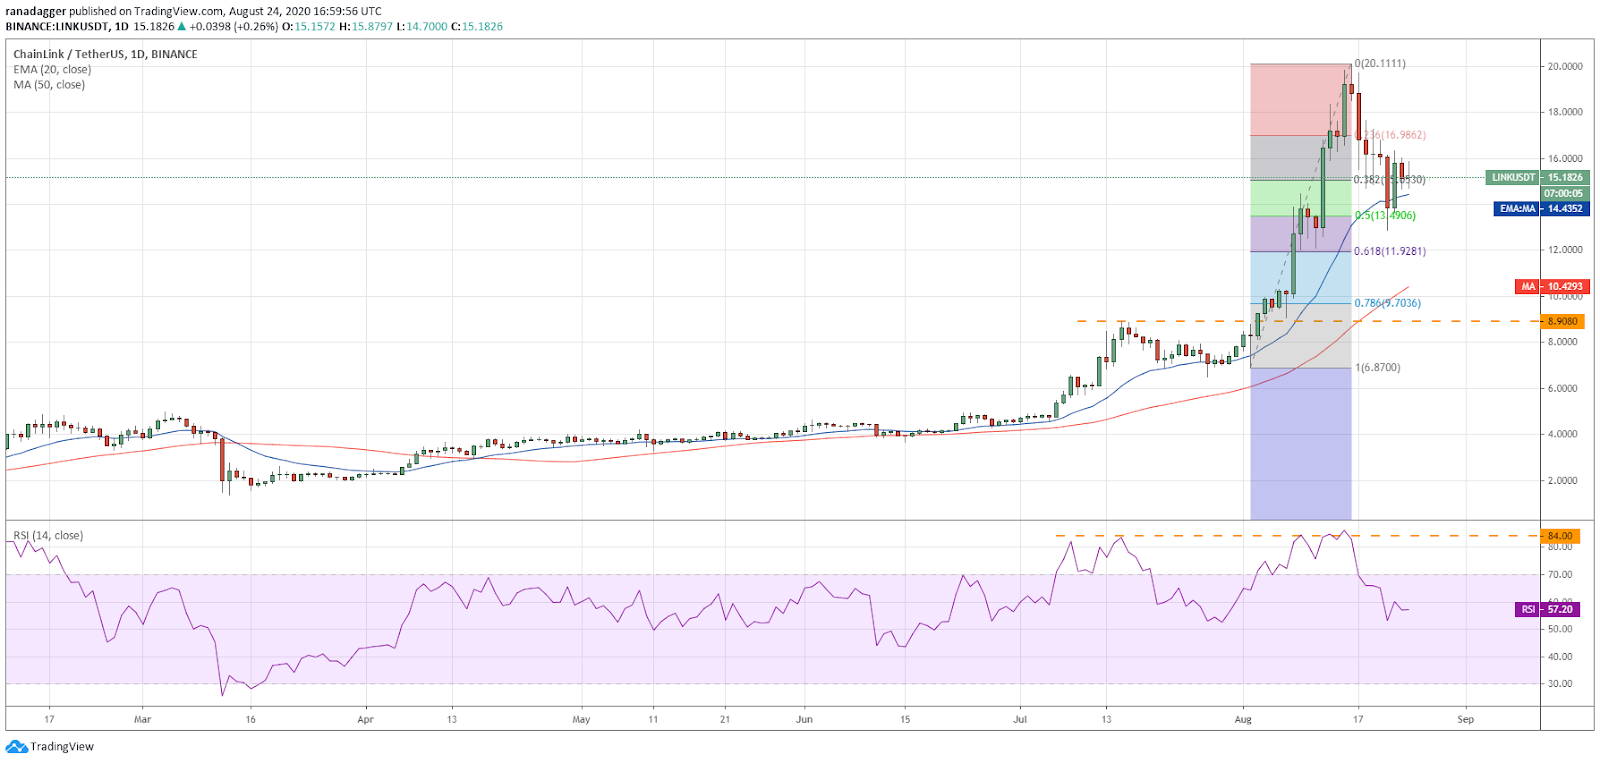
Chainlink (LINK) dipped below the 50% Fibonacci retracement level of $13.4906 on Aug. 21 but the price rebounded sharply on Aug. 22, which shows strong buying at lower levels.
LINK/USD daily chart. Source: TradingView
The LINK/USD pair is currently trading above the 20-day EMA ($14.43), which is gradually sloping up and the RSI is in the positive territory, suggesting a slight advantage to the bulls.
If the bulls can push the price above $16, the pair is likely to pick up momentum and move up to $17.6738. A breakout of this level can result in a retest of $20.1111.
Contrary to this assumption, if the pair turns down from $16, the bears will again try to sink the price below the 20-day EMA. If they succeed, a drop to $12.89 is likely.
LTC/USD
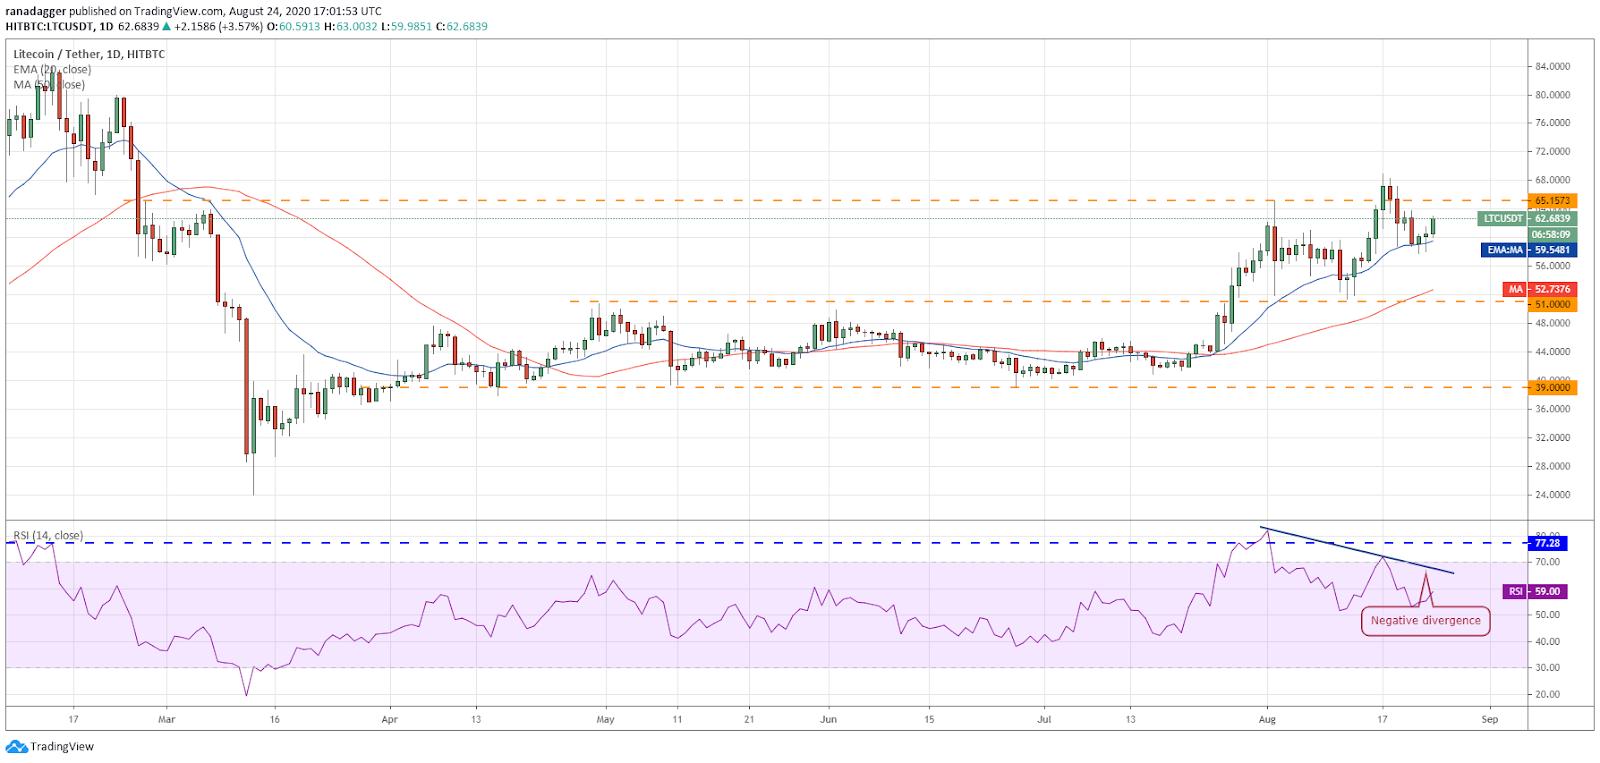
Litecoin (LTC) broke below the 20-day EMA ($59.54) on Aug. 22 and 23 but the bears could not sustain the lower levels, which suggests accumulation by the bulls on dips.
LTC/USD daily chart. Source: TradingView
Currently, the LTC/USD pair has bounced off the 20-day EMA and the bulls will try to push the price above the $65.1573–$68.9008 resistance zone. If they succeed, the uptrend is likely to resume, with the next target at $80.
The moving averages are sloping up and the RSI is also in the positive zone, which suggests that bulls are at an advantage.
This view will be invalidated if the pair turns down from the overhead resistance and breaks below the $57.7736 support.
BSV/USD
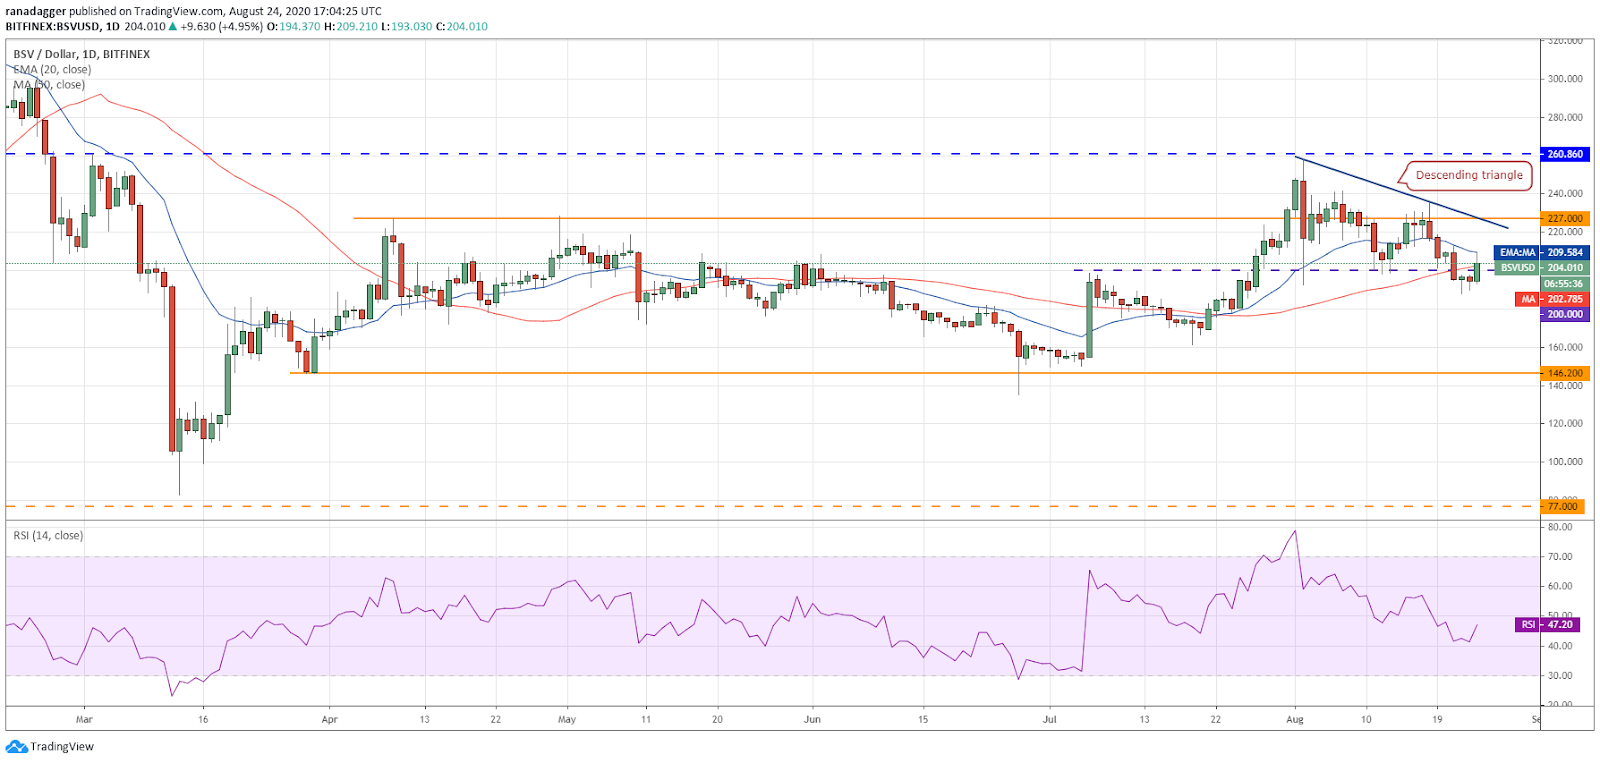
Bitcoin SV (BSV) broke down of the $200 support on Aug. 21, which completed the descending triangle pattern. This setup has a pattern target objective of $142.
BSV/USD daily chart. Source: TradingView
The 20-day EMA ($209) is sloping down and the RSI is in the negative zone, which suggests that the bears have the upper hand. If the bears defend the breakdown level of $200, the BSV/USD pair is likely to drop to $160.
However, if the bulls can push the price back above $200 and the 20-day EMA, a move to the downtrend line of the triangle is possible. A break above this resistance will shift the advantage in favor of the bulls.
CRO/USD
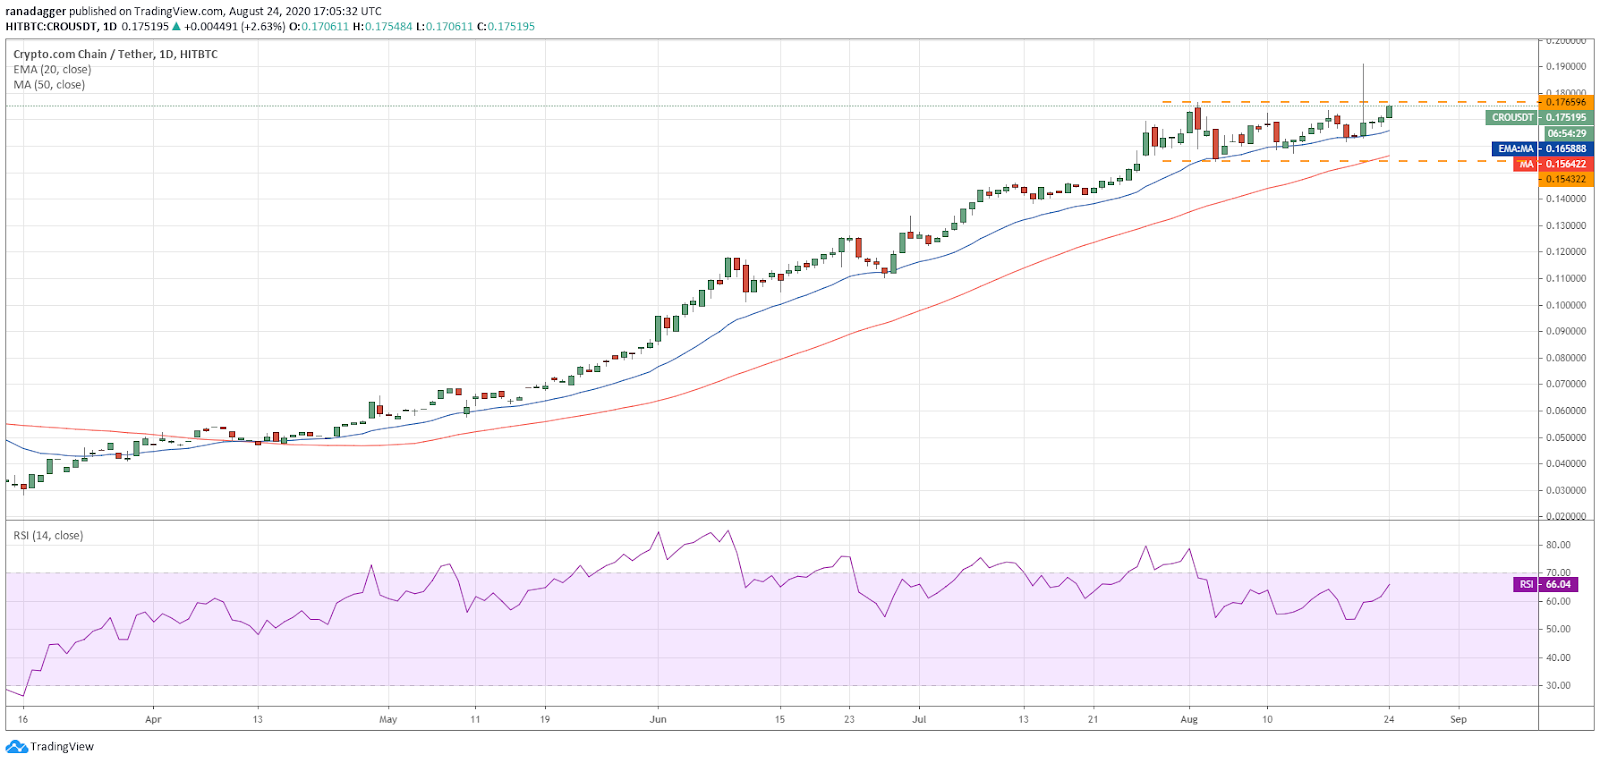
Crypto.com Coin (CRO) has bounced off the 20-day EMA ($0.165) and the bulls will now try to push the price above the $0.176596 resistance. If they succeed, the uptrend is likely to resume.
CRO/USD daily chart. Source: TradingView
The first target on the upside is $0.191101 and if this level is scaled, the next target is $0.20. The 20-day EMA is gradually sloping up and the RSI is in the positive zone, which suggests that the path of least resistance is to the upside.
This bullish view will be invalidated if the CRO/USD pair turns down from the overhead resistance and breaks below the 20-day EMA. Such a move will suggest that the momentum has weakened. A break below $0.154322 could start a deeper correction.
BNB/USD
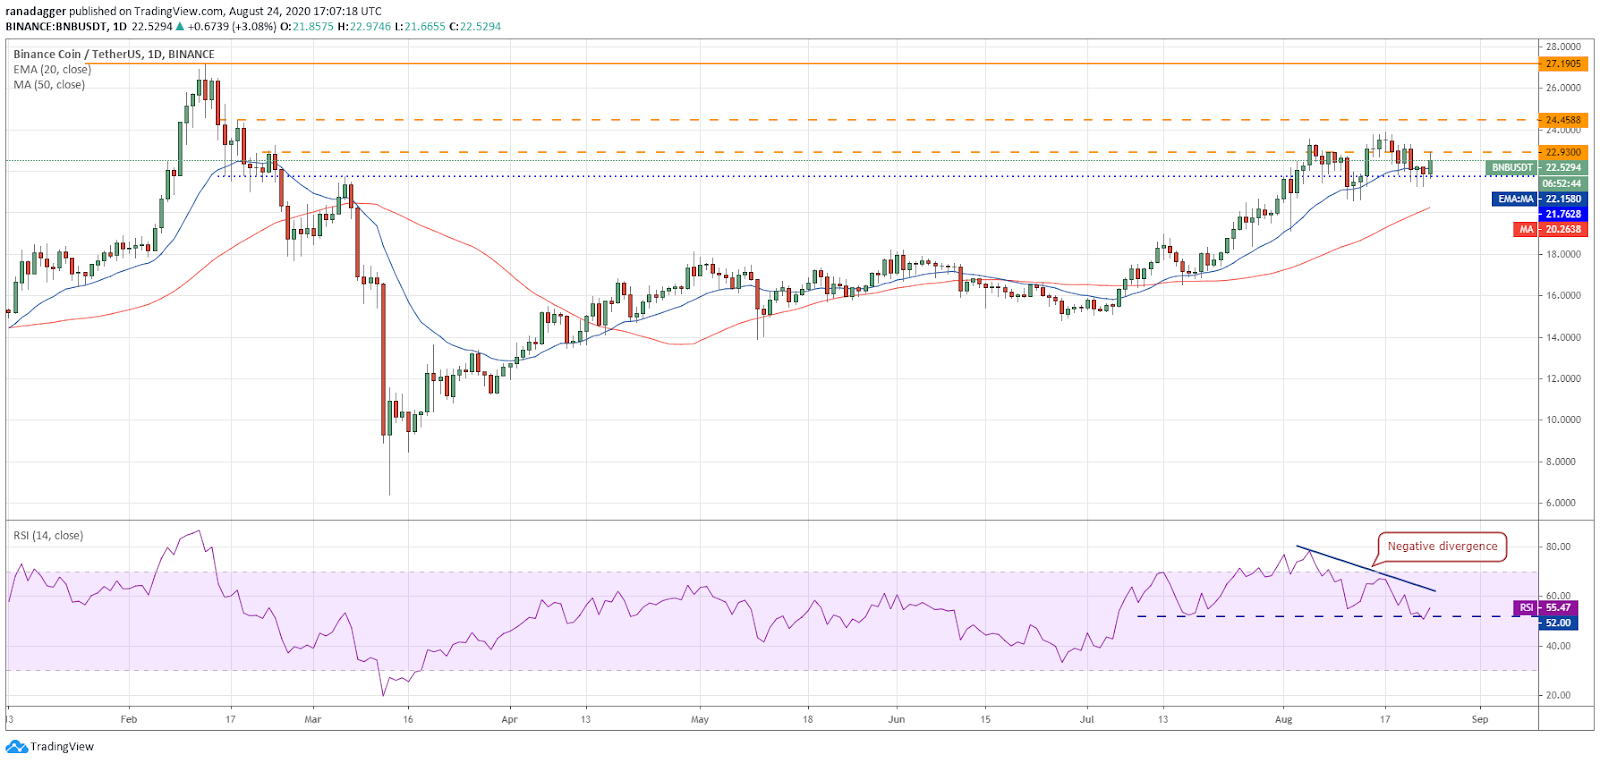
Binance Coin (BNB) broke below the 20-day EMA ($22.16) for three consecutive days between Aug. 21 to 23, but the bears could not sustain the price below the $21.7628 support, which suggests that the bulls are defending this support aggressively.
BNB/USD daily chart. Source: TradingView
The bulls are currently attempting a relief rally. If they can push the price above $22.93, a move to $24.4588 is possible. If this level is also scaled, the up move can extend to $27.1905.
Contrary to this assumption, if the BNB/USD pair turns down from $22.93, the bears will once again attempt to sink and sustain the price below $21.7628. If they succeed, a drop to the 50-day simple moving average ($20.26) is likely.
ADA/USD
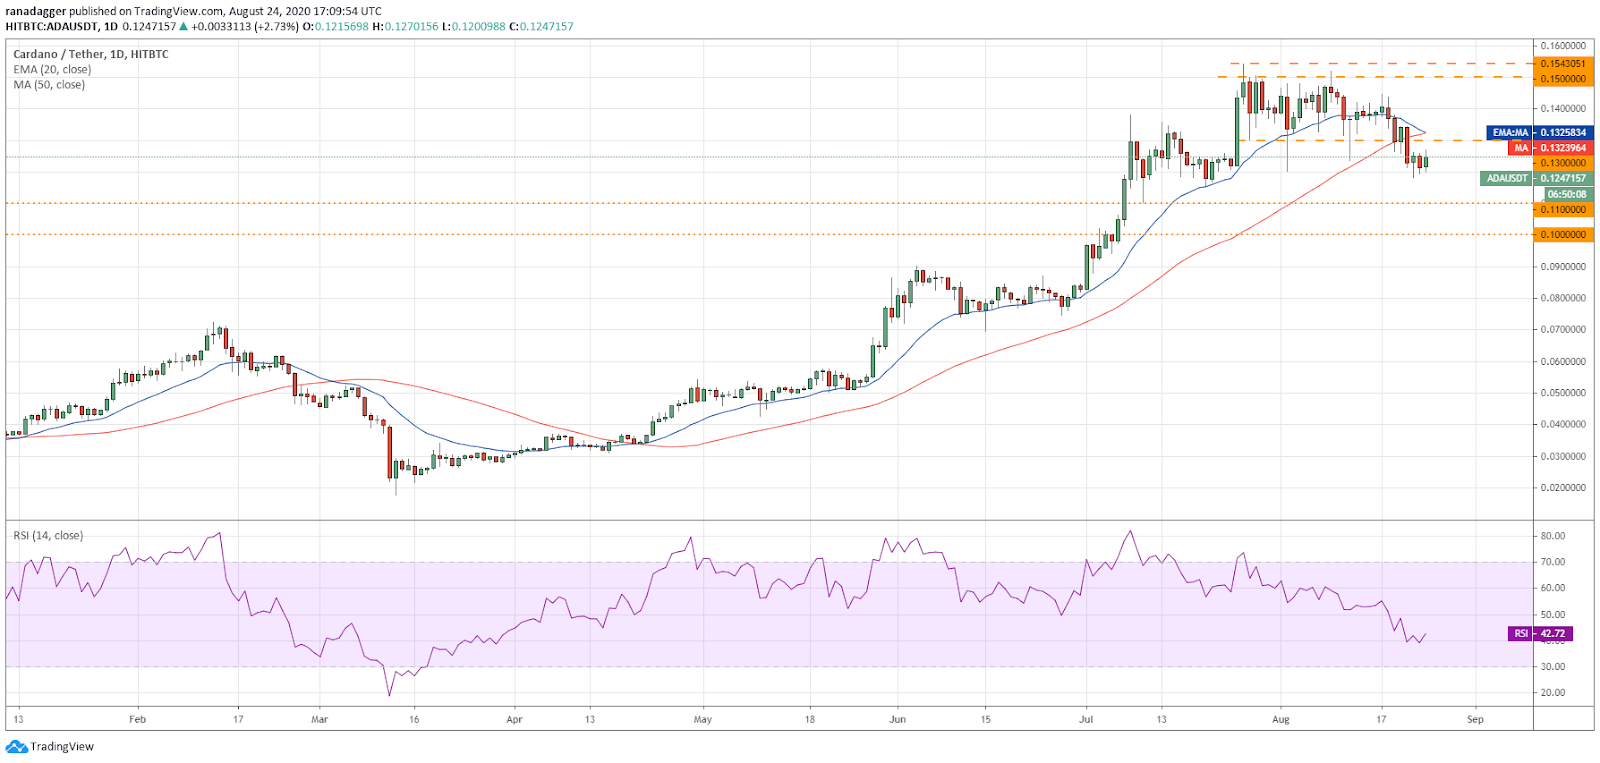
Cardano (ADA) decisively broke below the $0.13 support on Aug. 21, which points to a possible change in trend. The 20-day EMA ($0.132) has started to slope down and the RSI is in the negative territory, suggesting advantage to the bears.
ADA/USD daily chart. Source: TradingView
The first target objective on the downside is $0.11 and if that breaks, a drop to $0.10 is possible.
However, the bulls are unlikely to give up without a fight. They will try to push the price back above $0.13 and the 20-day EMA.
If they succeed, it will suggest strong demand at lower levels but if the price turns down from the overhead resistance, the downtrend is likely to resume.
The views and opinions expressed here are solely those of the author and do not necessarily reflect the views of Cryptox. Every investment and trading move involves risk. You should conduct your own research when making a decision.
Market data is provided by HitBTC exchange.

