Bitcoin and many altcoins are struggling to rise above the 20-day EMA, suggesting bears have the advantage in the short-term.
Tesla’s market capitalization has surged from about $76 billion at the start of 2020 to $224.18 billion at market close on July 2. This unending rally has also made it the largest car company in terms of market capitalization, even though it produces only a fraction of cars compared to the second-ranked Toyota motors. One of the reasons for the sharp rise in Tesla’s stock is investors’ expectation that the company will disrupt the cars running on fossil fuel.
Similarly, Bitcoin (BTC) and altcoins are likely to disrupt fiat currencies and gold over the next few years. However, the current price of the top-ranked asset on CoinMarketCap does not capture this change. This shows that the crypto space is still in its early days of development and as the space matures cryptocurrency prices are likely to rise higher.
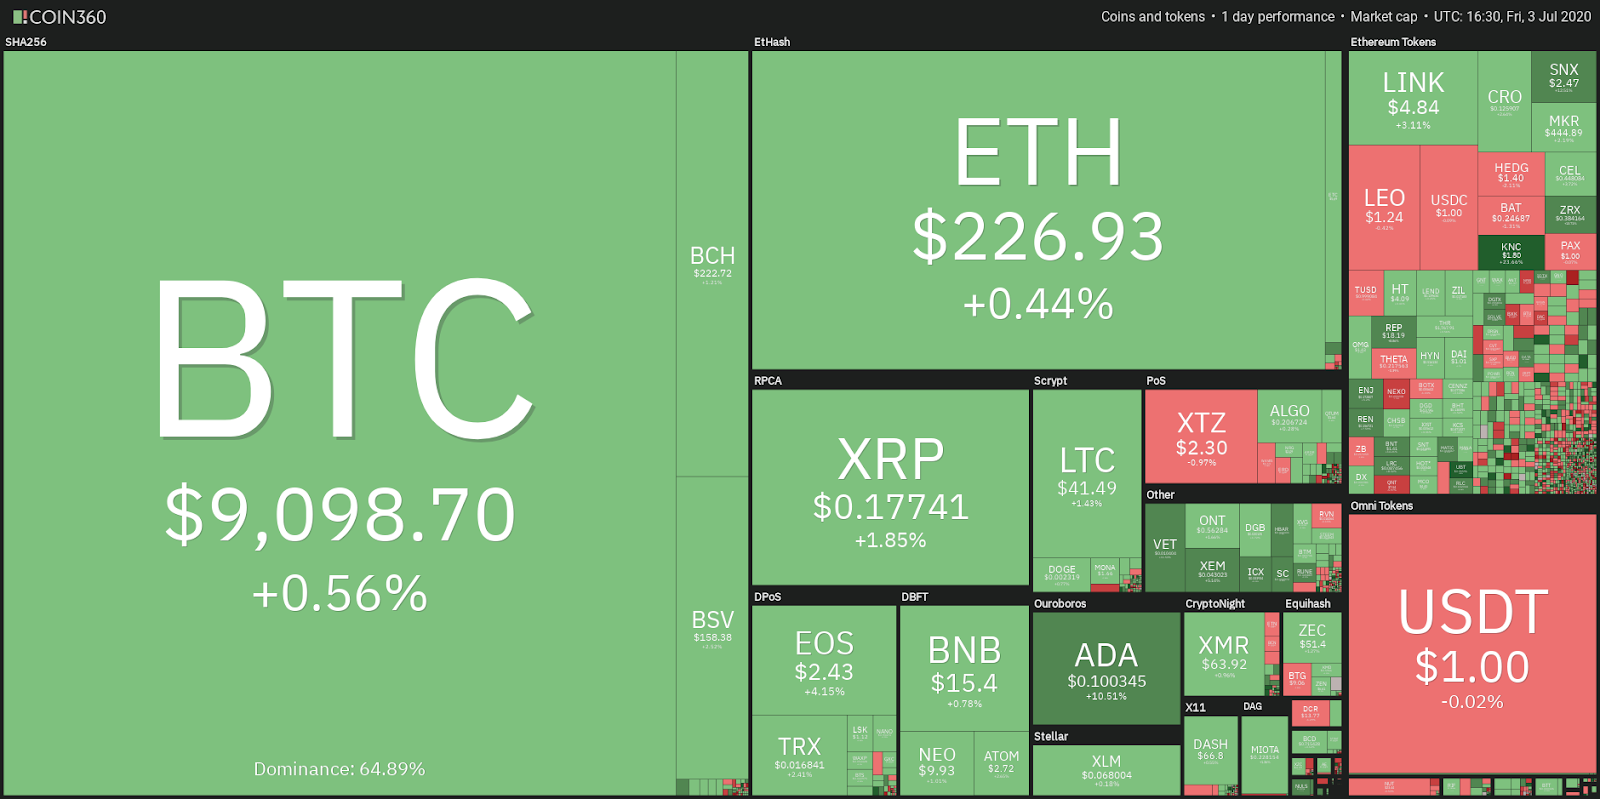
Daily cryptocurrency market performance. Source: Coin360
Bitcoin’s fundamentals continue to improve and it is only a matter of time before the price plays catch up. However, until this happens, investors should be patient and use the dips to accumulate for the long-term. Instead of the vertical move seen in 2017, a gradual up move should be preferred as it is likely to last longer.
BTC/USD
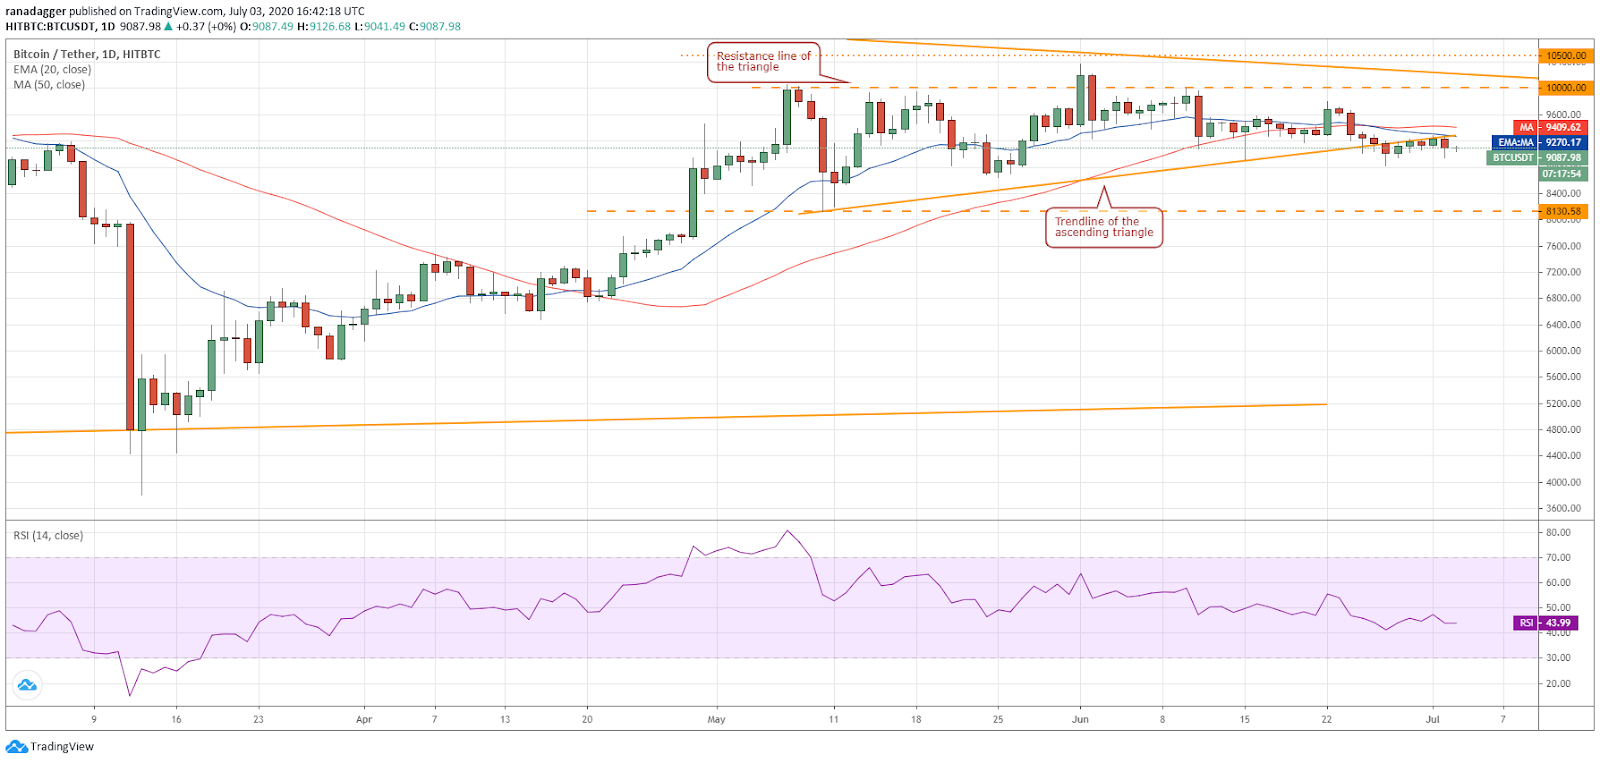
The bulls could not propel Bitcoin (BTC) above the 20-day exponential moving average ($9,270), which shows that the bears are aggressively defending this resistance. However, a minor positive is that the buyers again stepped in and purchased the dip below $9,000 on July 2, suggesting accumulation at lower levels.
BTC/USD daily chart. Source: Tradingview
The 20-day EMA is gradually sloping down and the relative strength index is sustaining below the 50 level, which suggests that bears have a minor advantage. A break below $8,825 will open the doors for a fall to the next minor support at $8,638.79 and below it to the critical level at $8,130.58.
Conversely, if the bulls can push the BTC/USD pair above the 50-day simple moving average ($9,410), a rally to $10,000 is possible. It will be an uphill task for the bulls to clear the stiff resistance zone of $10,000–$10,500 but if the momentum can carry the price above this zone, a new sustained uptrend is likely.
ETH/USD
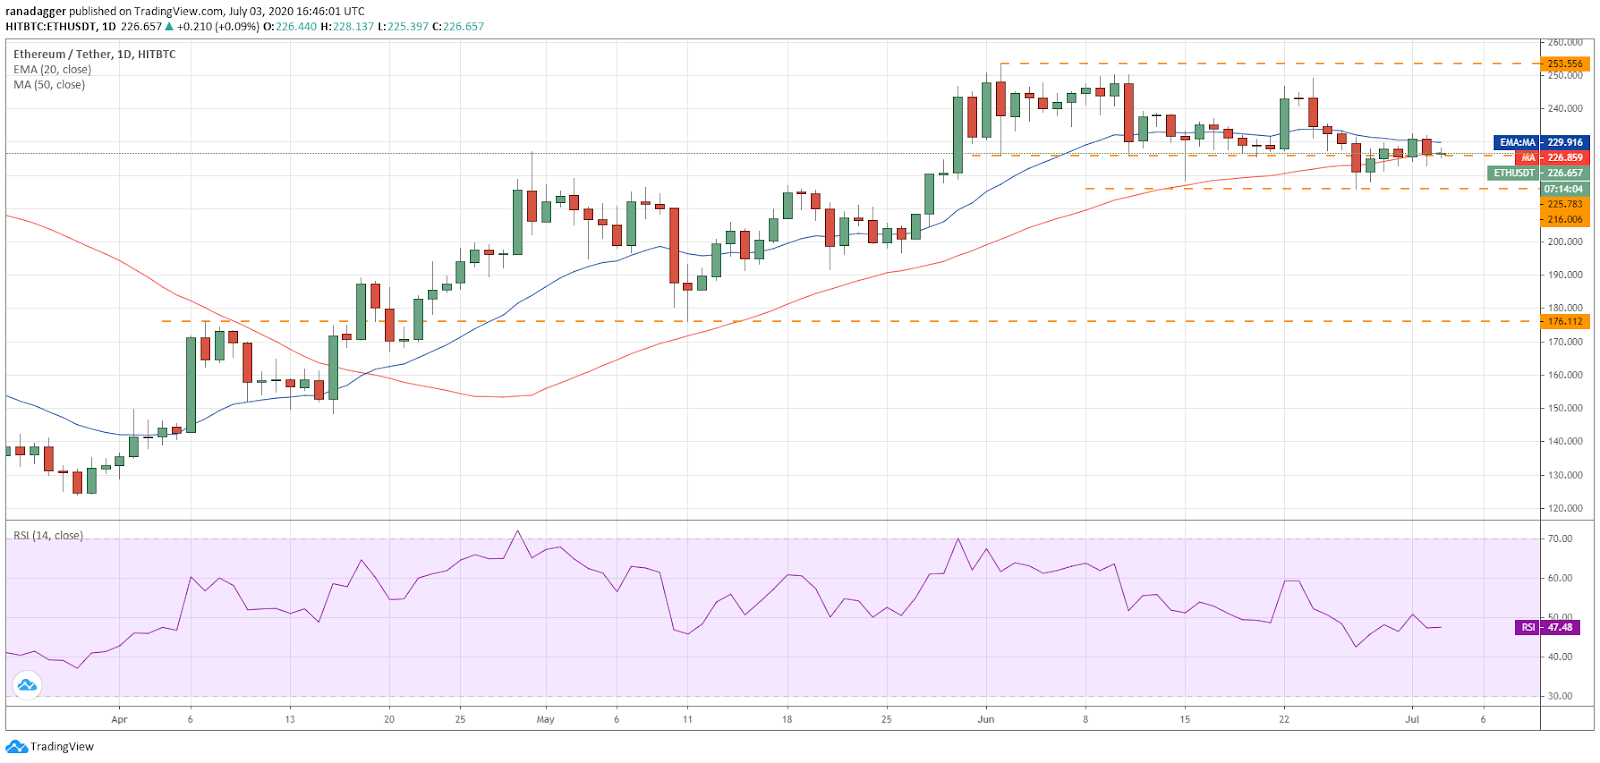
Ether (ETH) again turned down from the 20-day EMA ($230) on July 2, which suggests that the bears are selling on minor rallies to critical overhead resistance levels. However, the bears are not able to maintain the selling pressure at lower levels.
ETH/USD daily chart. Source: Tradingview
Currently, the bulls are attempting to keep the second-ranked cryptocurrency on CoinMarketCap above the 50-day SMA ($227). If they succeed, the possibility of a break above the 20-day EMA increases.
There is a minor resistance at $233 but if the bulls can propel the price above it, the up move can reach $253.56. A breakout of this resistance is likely to resume the uptrend.
This bullish view will be invalidated if the ETH/USD pair breaks below the $216.006 support. If that happens, a drop to $200 and then to $176.112 is possible.
XRP/USD
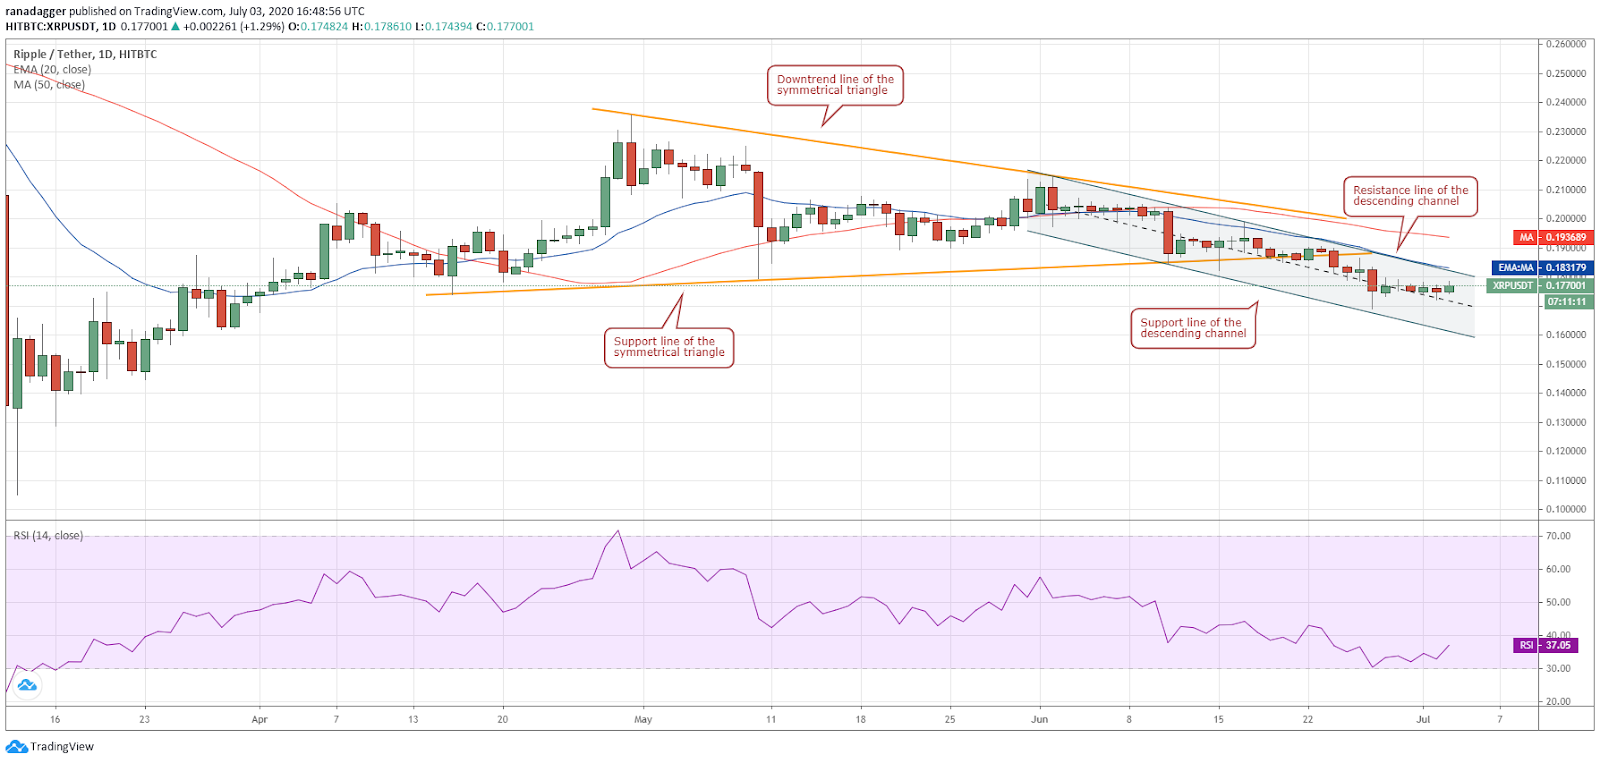
XRP continues to trade inside the descending channel with both moving averages sloping down and the RSI in the negative territory. This suggests that the bears have the upper hand.
XRP/USD daily chart. Source: Tradingview
However, the price action has been stuck inside a tight range for the past few days, which suggests that the bulls and the bears are undecided about the next trending move.
If the bulls can propel the fourth-ranked cryptocurrency on CoinMarketCap above the descending channel, it will be the first sign that the downtrend might be over. The bears might defend the 50-day SMA ($0.193) aggressively but if the bulls can push the price above it, a trend change is likely.
Conversely, if the bears can sink the price below the $0.172205–$0.169012 support zone, the decline can extend to the support line of the channel. A break below the channel is likely to intensify selling resulting in a long liquidation. The next support on the downside is the $0.14–$0.13 zone.
BCH/USD
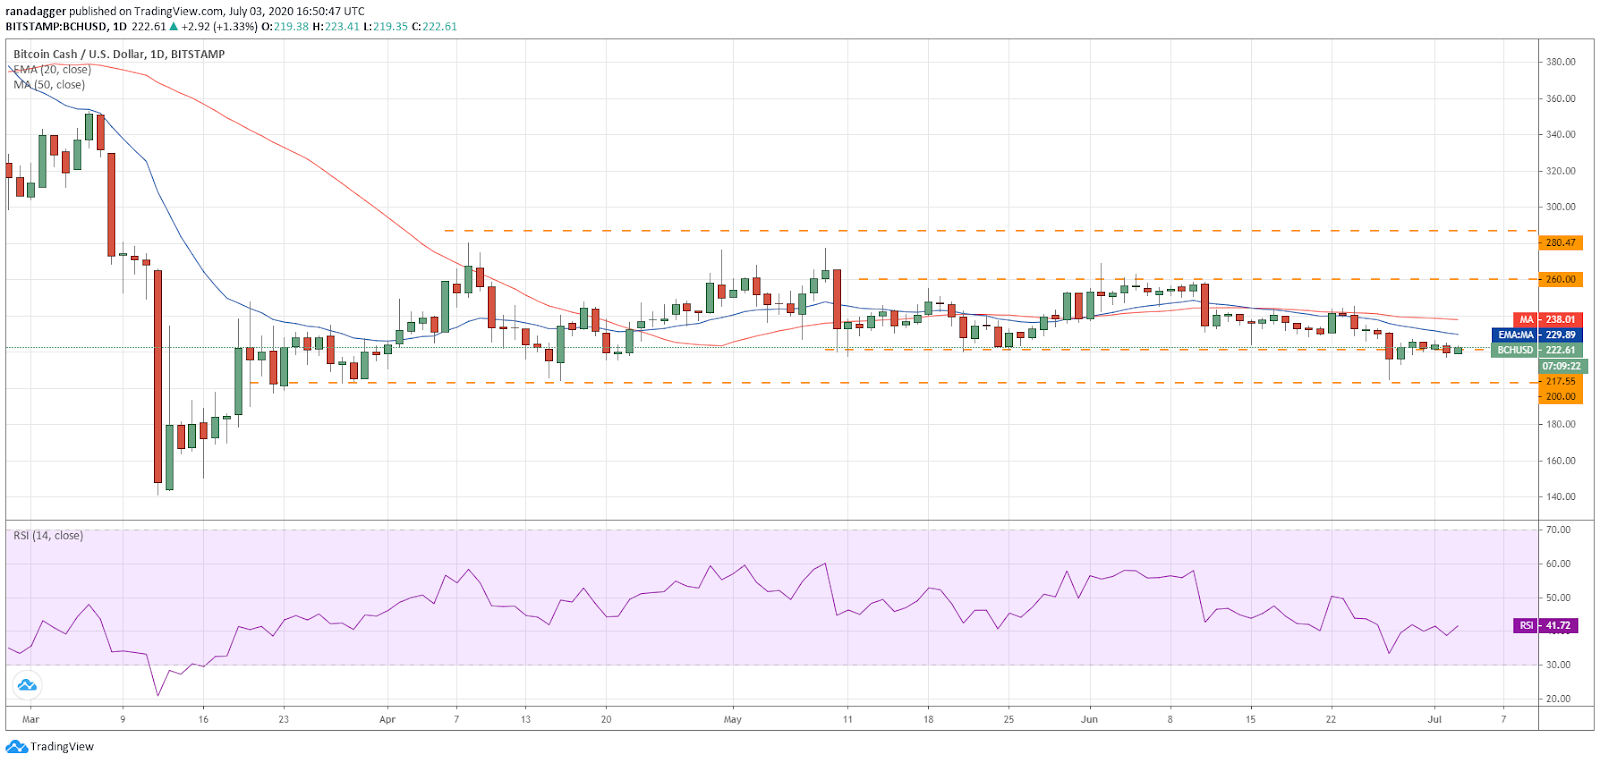
The bulls seem to be in no hurry to buy Bitcoin Cash (BCH) even at the current levels because they are not confident that the altcoin will start its journey northward. However, they have not allowed the price to dip below $217.55 either, which suggests accumulation at lower levels.
BCH/USD daily chart. Source: Tradingview
If the bulls can push the fifth-ranked cryptocurrency on CoinMarketCap above the moving averages, it will signal strength and could result in a rally to $260.
Nevertheless, if the BCH/USD pair again turns down from the 20-day EMA ($230), it will indicate that the bears are aggressively selling on minor rallies. A break below $217.55 can drag the price to $200 and if this support also cracks, a new downtrend is likely.
The first support on the downside is $180 and if that gets broken, the decline can extend to $165.
BSV/USD
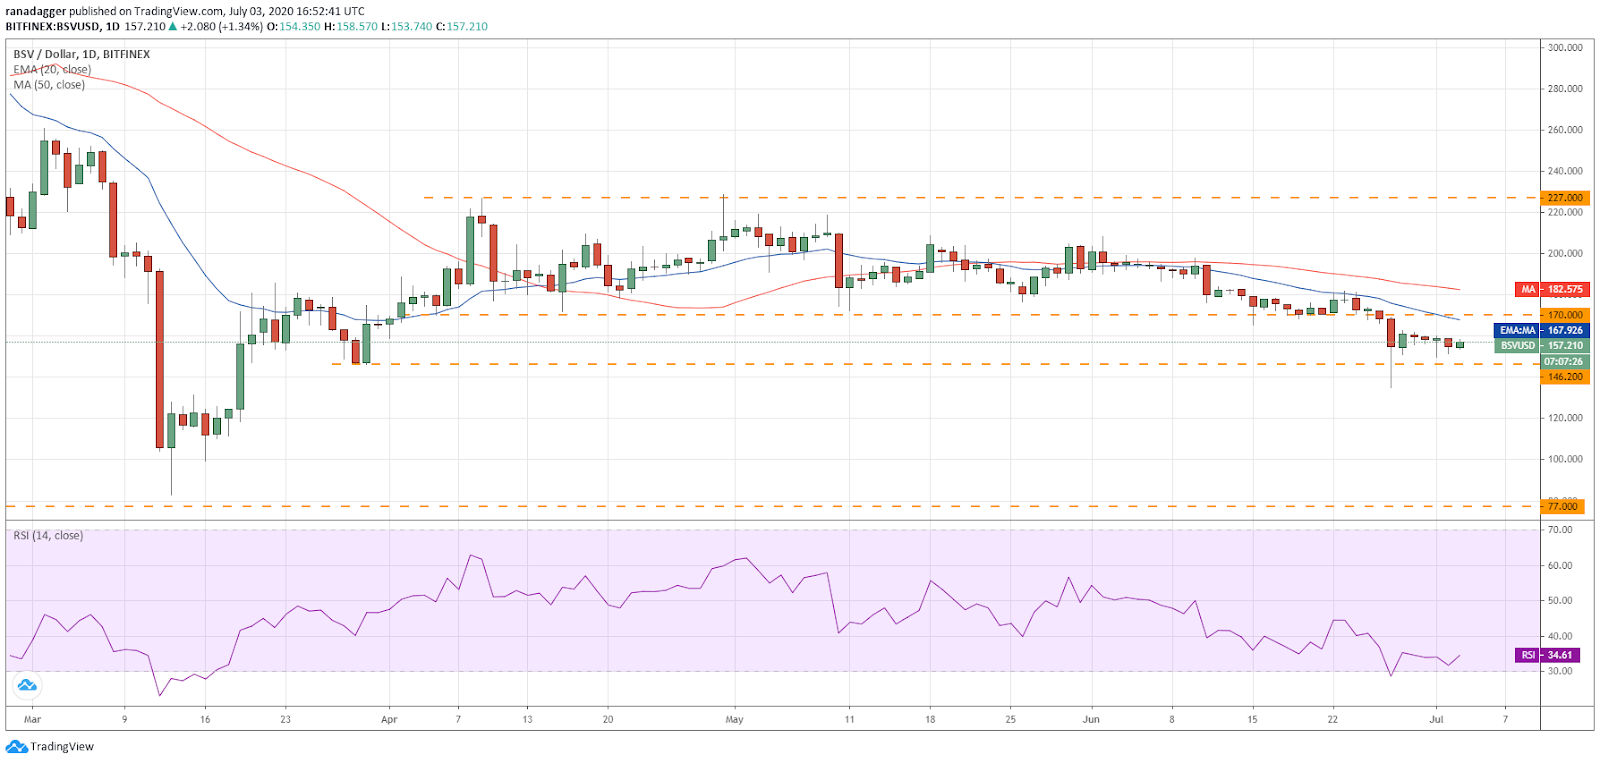
Although the bulls purchased the dip to $149.57 on July 1, they have not been able to push the price above $162.53, which suggests a lack of demand at higher levels. The bears will now try to sink Bitcoin SV (BSV) below the $146.20–$135 zone.
BSV/USD daily chart. Source: Tradingview
If successful, the sixth-ranked cryptocurrency on CoinMarketCap can decline to $120 and then to $100. The downsloping moving averages and the RSI close to the oversold territory indicates that the path of least resistance is to the downside.
Contrary to this assumption, if the BSV/USD pair rebounds sharply from $146.20 and climbs above $170, it will signal that the bulls have overpowered the bears. That will increase the likelihood of the pair gradually rising to $200 and then to $227.
LTC/USD
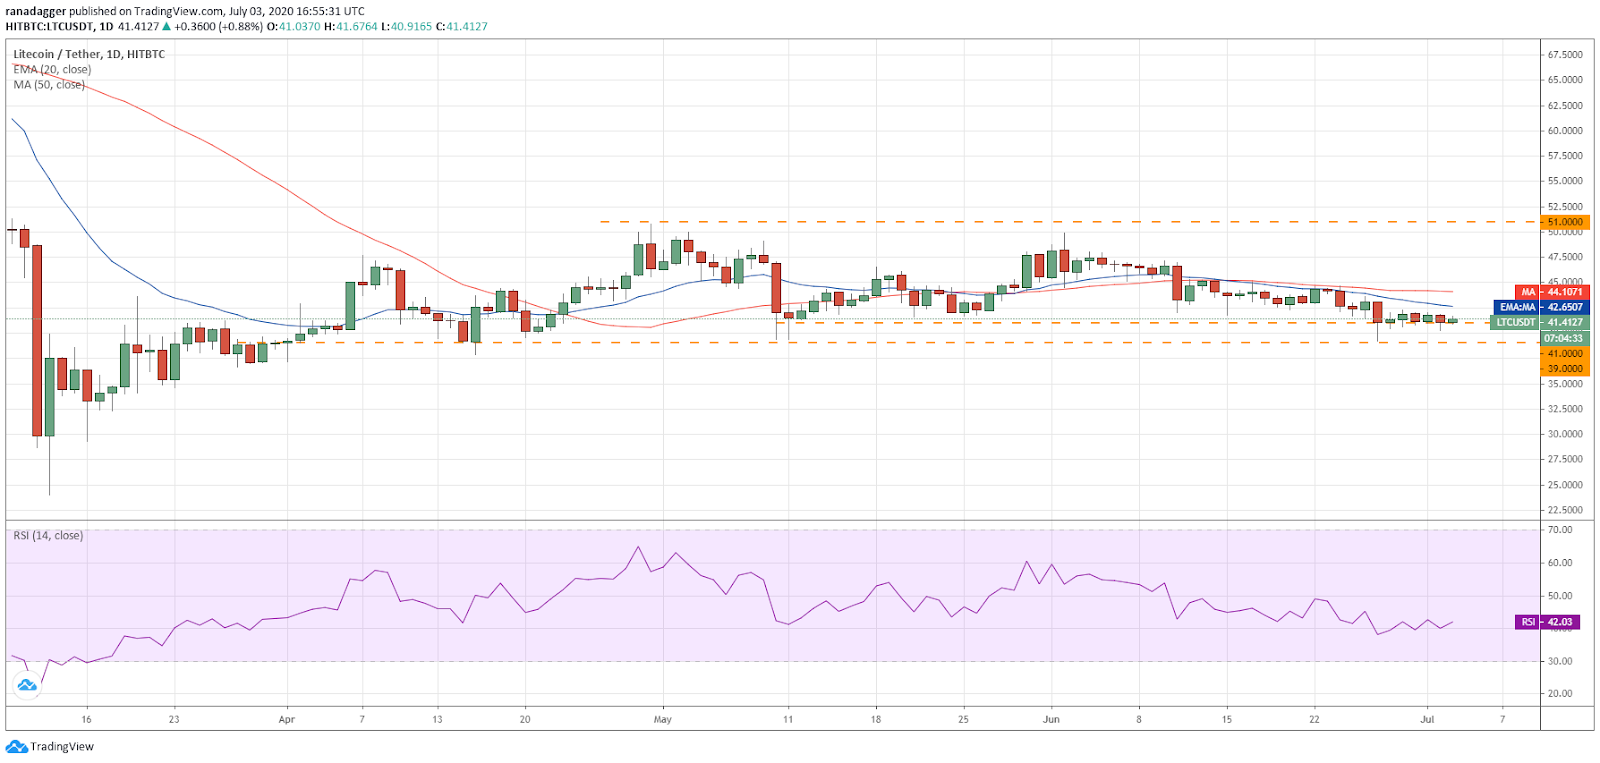
The bulls have not been able to push Litecoin (LTC) even to the 20-day EMA ($42.64) in the past five days, which suggests a lack of urgency to buy even at these levels as the bulls are not confident that a bottom is in place yet.
LTC/USD daily chart. Source: Tradingview
The bears are now likely to attempt a breakdown below the critical support at $39. If that happens, a new downtrend is likely to begin, which has a target objective of $31.
However, it is unlikely to be a waterfall decline as the bulls will try to stall the decline at $35 and then again at $32.50.
If the seventh-ranked cryptocurrency on CoinMarketCap rises from the current levels and breaks above the moving averages, it will signal strength and increase the possibility of a rally to $51.
ADA/USD
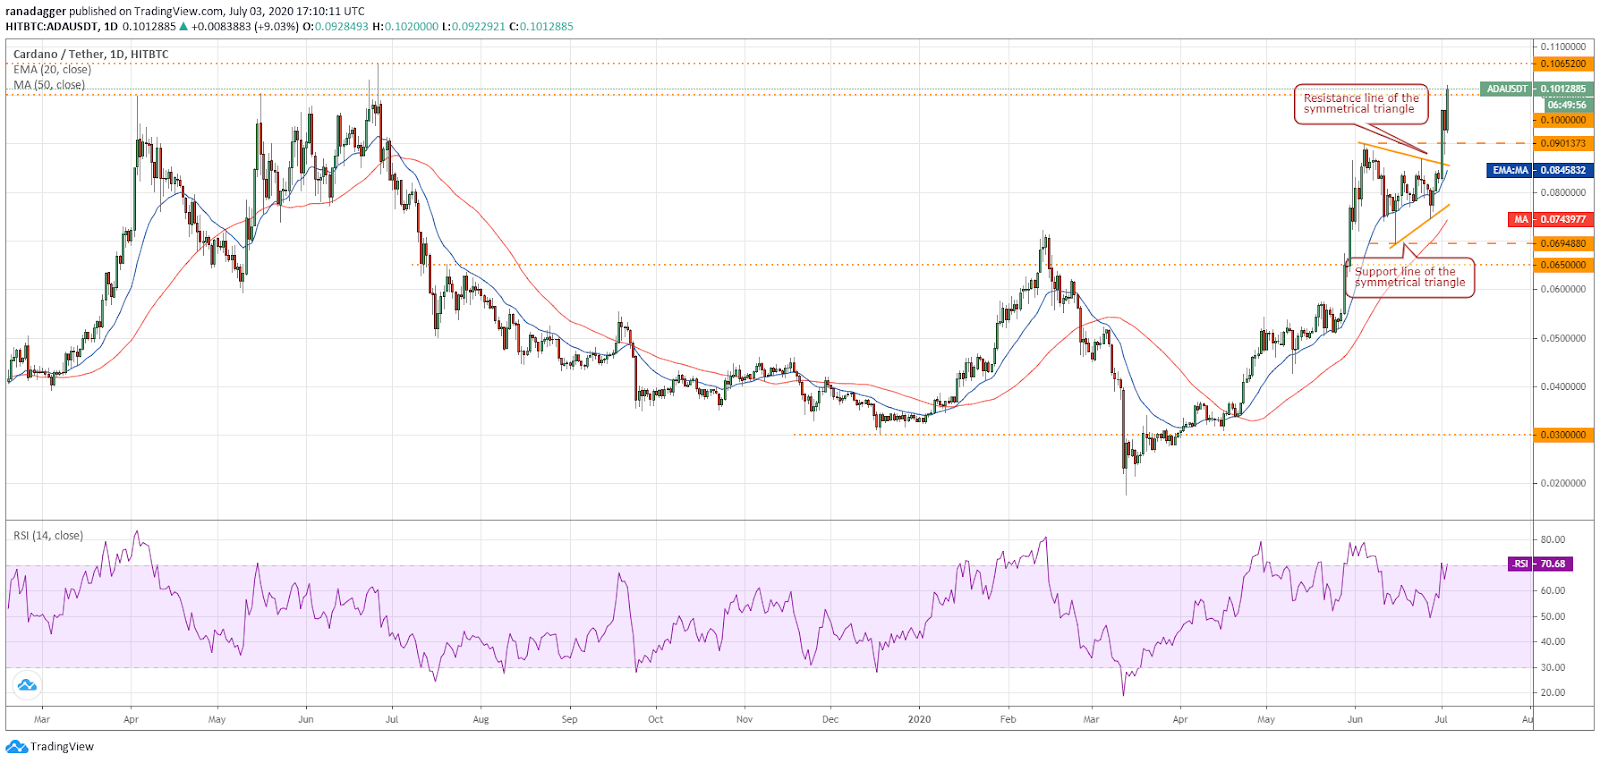
After a strong breakout from the symmetrical triangle on July 1, Cardano (ADA) completed a quick retest of the breakout level on July 2. This showed that the sentiment remains positive with the bulls looking to buy the dips.
ADA/USD daily chart. Source: Tradingview
The eighth-ranked cryptocurrency on CoinMarketCap has broken above $0.0970103 and touched the first target objective of $0.10.
Above this level, the rally can extend to $0.10686. However, the zone between $0.10–$0.10686 is likely to act as a stiff resistance and a few days of consolidation or a minor correction cannot be ruled out.
This bullish view will be invalidated if the ADA/USD pair turns down sharply from the current levels and slips below the 20-day EMA ($0.0845).
BNB/USD
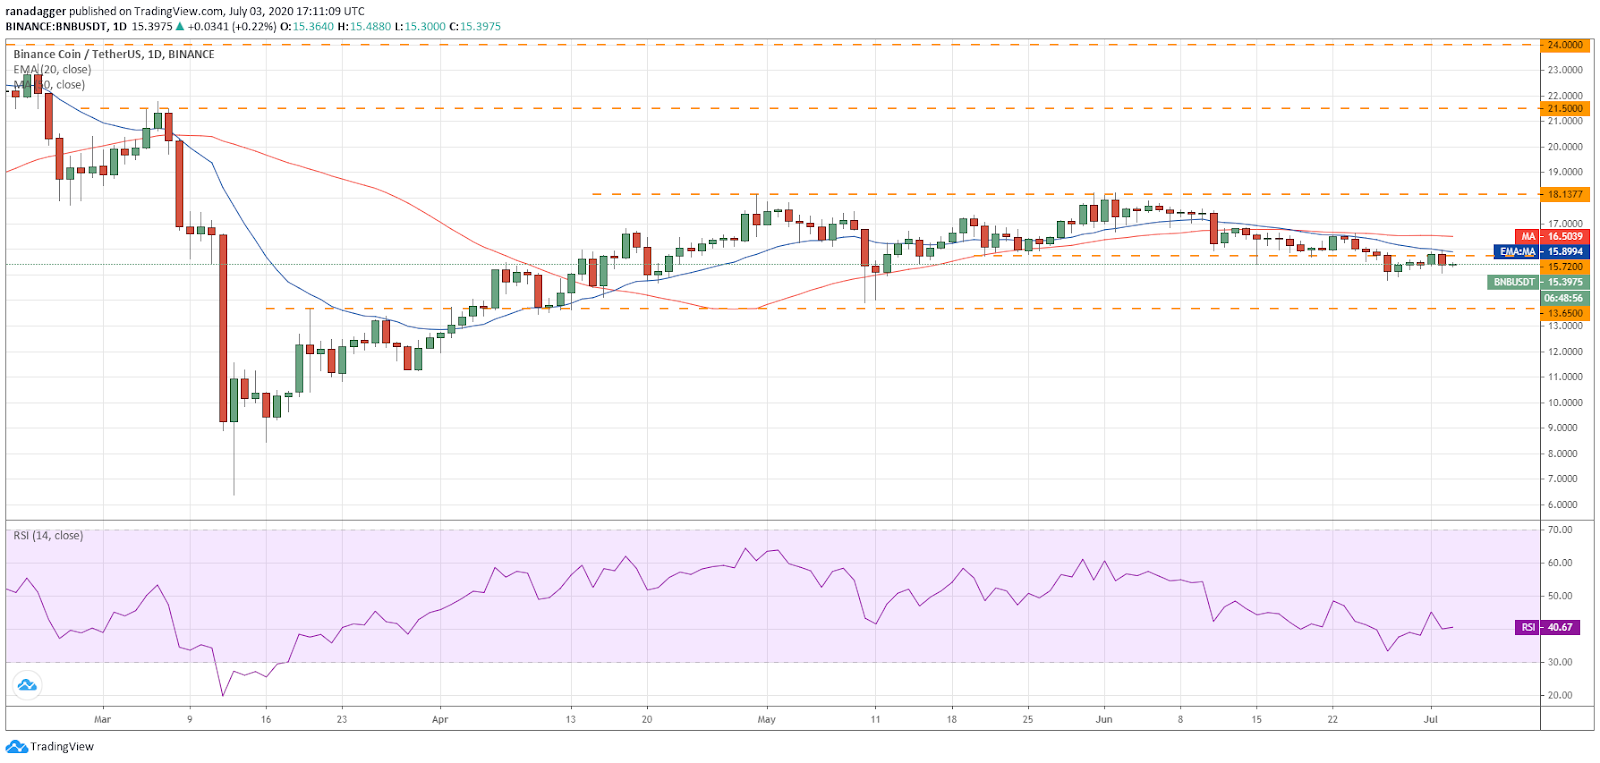
Binance Coin (BNB) turned down from the 20-day EMA ($15.89) on July 2, which suggests that the bears are aggressively defending this resistance. The 20-day EMA continues to slope down and the RSI is close to 40 levels, which shows that bears have the upper hand.
BNB/USD daily chart. Source: Tradingview
The bears will now try to sink the ninth-ranked crypto-asset on CoinMarketCap below $14.80 and if they succeed, a drop to $13.65 is possible. This is a critical level and if this also cracks, a new downtrend could start.
Conversely, if the BNB/USD pair bounces off $13.65, it could signal an extension of the range-bound action for a few more days.
Instead, if the pair rises from the current levels and climbs above the 50-day SMA ($16.50), a move to $18.1377 is likely. A break above this resistance could start a new uptrend.
EOS/USD
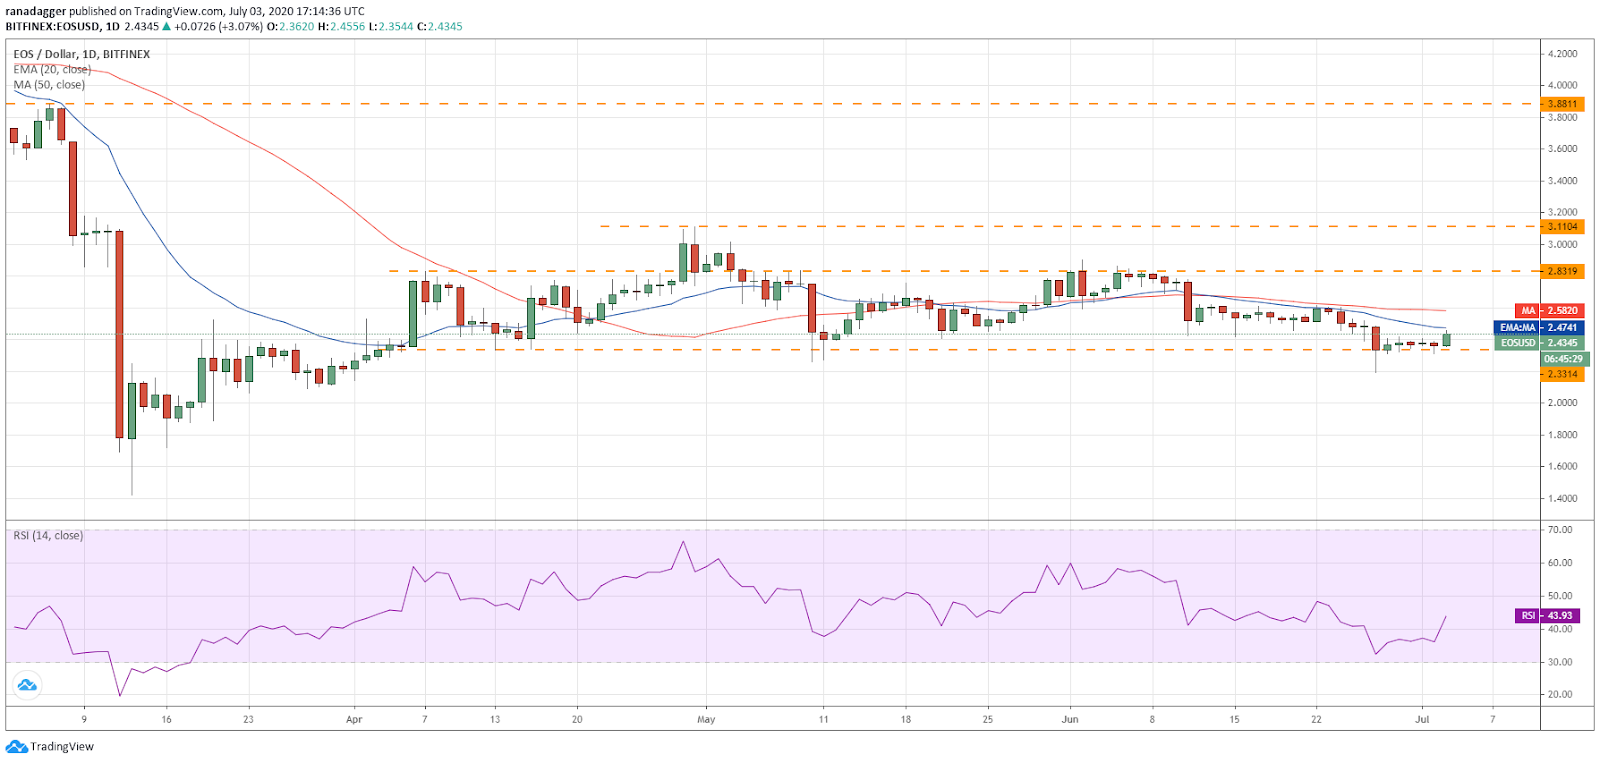
There is a tough tussle in progress between the bulls and the bears at the critical support at $2.3314. The bears want to break below this support and resume the downtrend while the bulls are attempting to defend the support and keep EOS inside the $2.3323–$2.8319 range.
EOS/USD daily chart. Source: Tradingview
The bulls will have to push the 10th-ranked cryptocurrency on CoinMarketCap above both moving averages to signal strength. Above this level, a rally to $2.8319 is possible.
Conversely, if the EOS/USD pair does not climb above the moving averages, the bears are likely to sink the price below $2.3314, resulting in a retest of the June 27 low of $2.1926. If this support also cracks, a deeper correction to $1.80 is possible.
The 20-day EMA ($2.47) is sloping down and the RSI is in the negative zone, suggesting that bears have the upper hand
CRO/USD
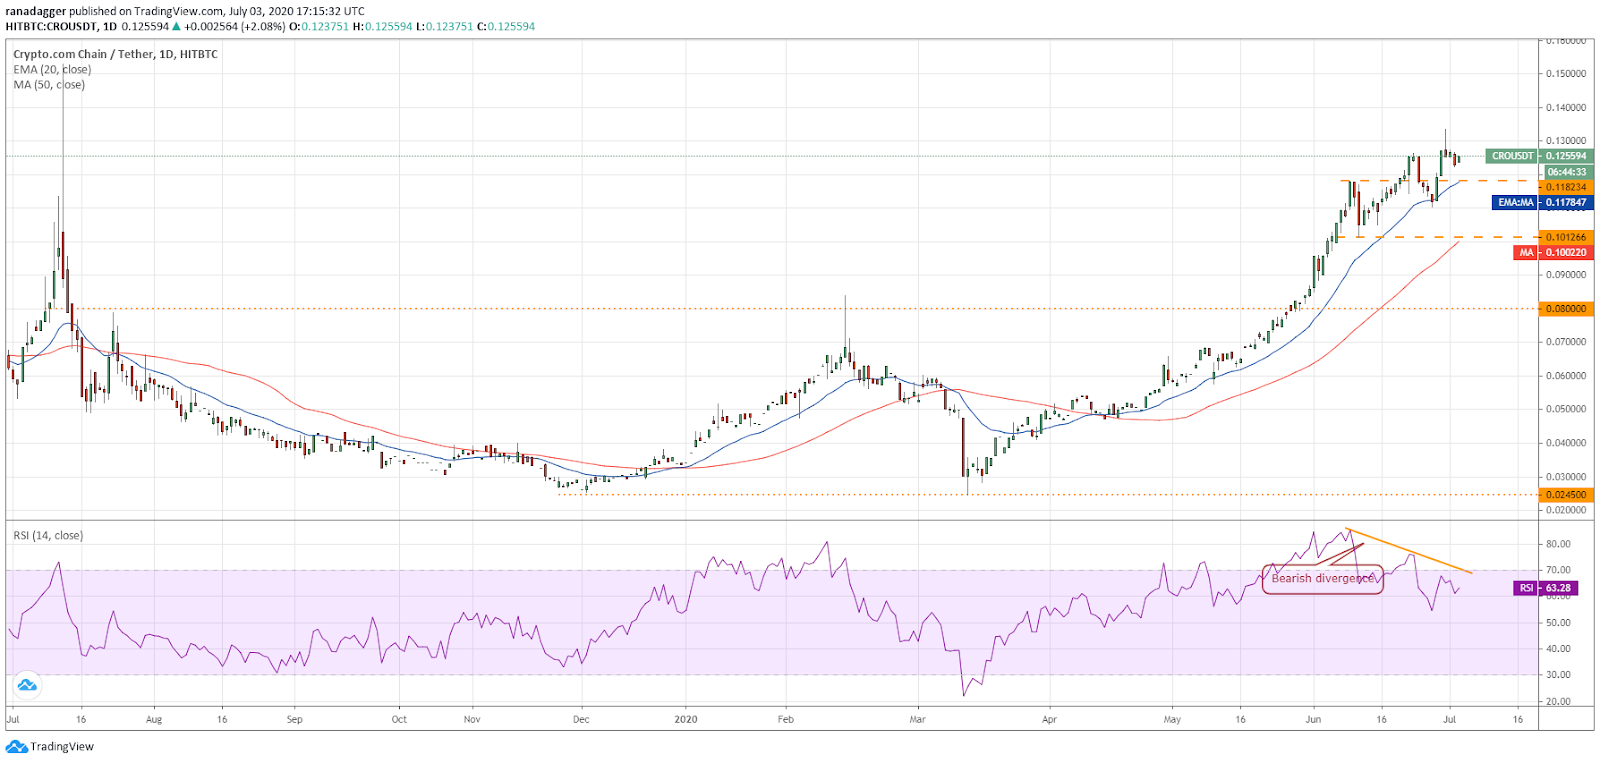
Crypto.com Coin (CRO) is going through a minor correction but the overall trend remains bullish. Both moving averages are sloping up and the RSI remains in the positive territory, suggesting that bulls have the upper hand.
CRO/USD daily chart. Source: Tradingview
The failure of the bears to even drag the price to the 20-day EMA ($0.117) suggests that the bulls are not in a hurry to book profits as they expect the uptrend to resume. If the 11th-ranked cryptocurrency on CoinMarketCap rallies above $0.133539, a move to $0.15306 is possible.
However, the bearish divergence on the RSI is still intact, which will come into play after the bears sink the CRO/USD pair below the 20-day EMA. If that happens, a drop to $0.11 and then to $0.101266 is likely.
The views and opinions expressed here are solely those of the author and do not necessarily reflect the views of Cryptox. Every investment and trading move involves risk. You should conduct your own research when making a decision.
Market data is provided by HitBTC exchange.


