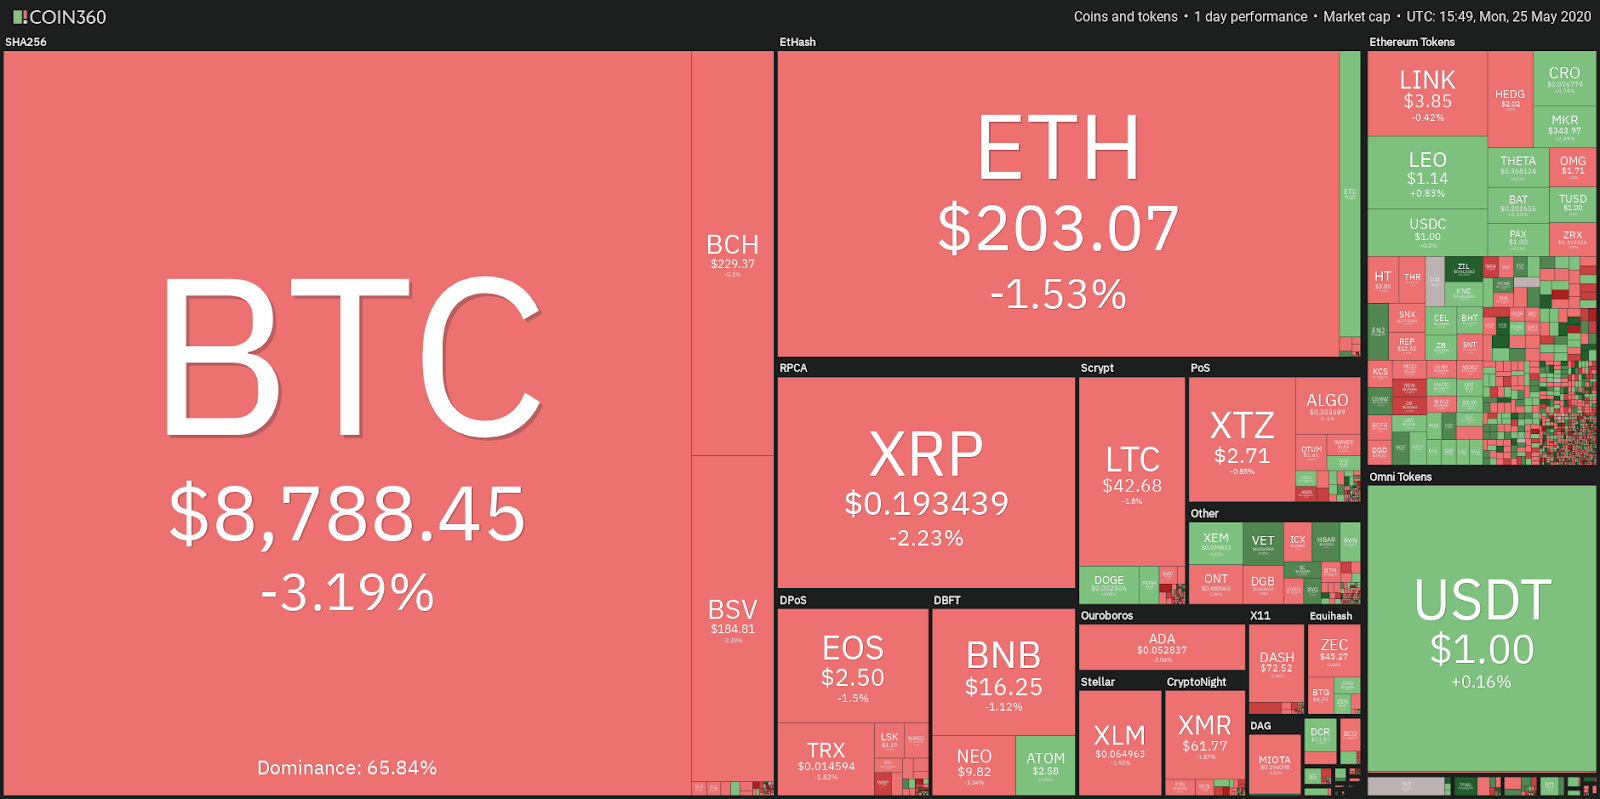
Several major cryptocurrencies have turned down from their resistance levels, hinting that further downside could occur in the short-term.
Bitcoin (BTC) has neither run away nor plunged following its halving, which suggests that history might be repeating itself. After the first halving, the top-ranked cryptocurrency on CoinMarketCap moved up only by 7% after a month. After the second halving the price dipped 10% during the same period.
However, the important thing to note is that both the halvings were followed by strong bull runs. Therefore, even if history doesn’t repeat itself it could still offer handsome returns to investors at a time when the global economies are staring at their worst recessions in decades.
Daily cryptocurrency market performance. Source: Coin360
Although the bull markets following the previous two halvings were vertical in nature, the next bull market is likely to follow a gradual trajectory. This is because the derivatives market will keep the exuberance under check for some time. Nonetheless, every bull market ends with a parabolic move and the same can happen with Bitcoin as well.
Therefore, investors could use the dips as an opportunity to build their long-term portfolio. Let’s study the charts of the major cryptocurrencies to spot the critical support levels that can offer buying opportunities to traders.
BTC/USD
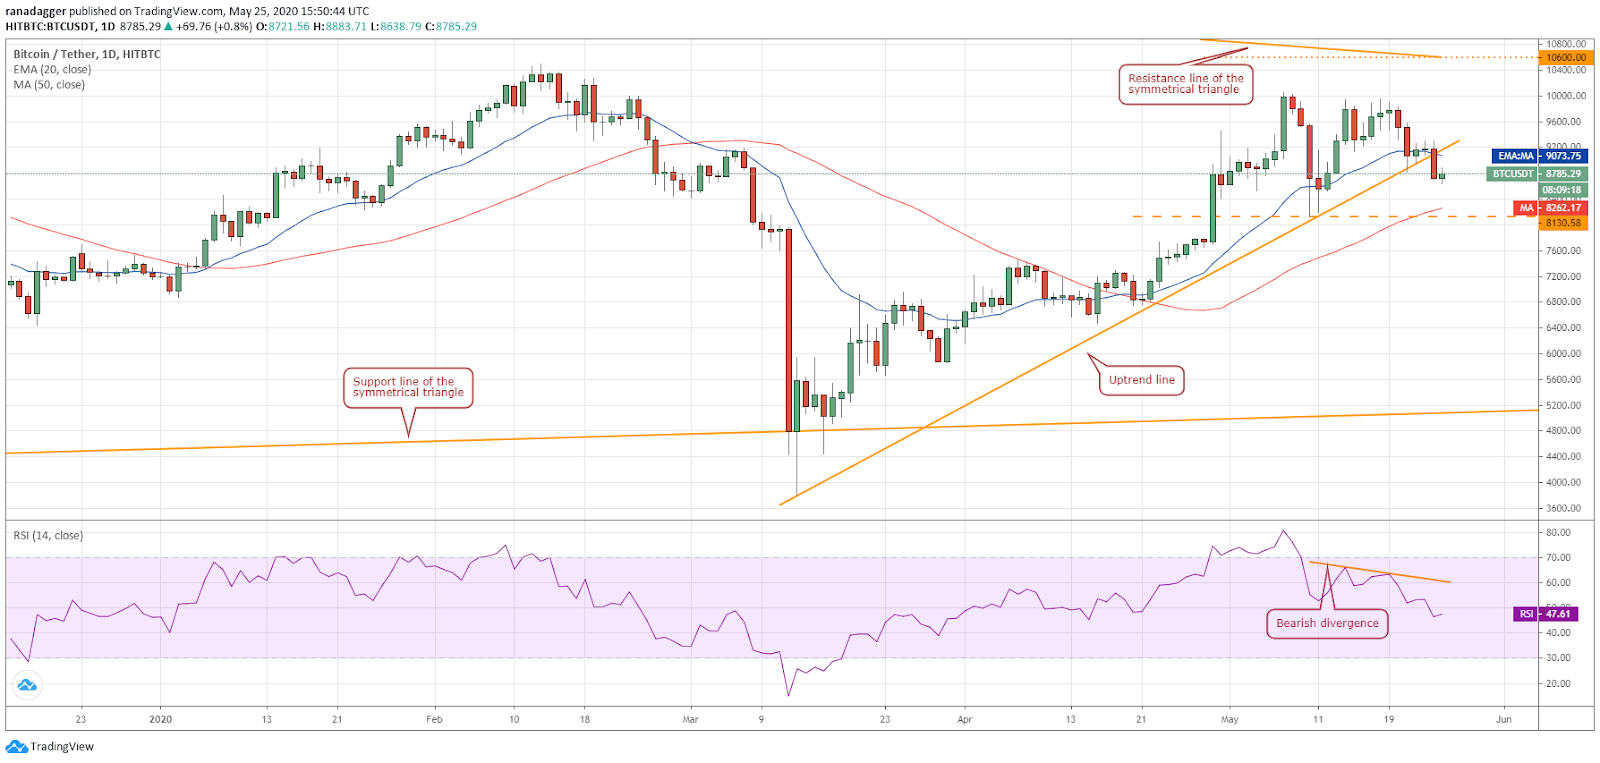
Bitcoin (BTC) broke below the uptrend line on May 24. If the bulls fail to push the price back above the uptrend line within the next couple of days, it will suggest that the uptrend has ended.
BTC–USD daily chart. Source: Tradingview
The next support on the downside is $8,130.58, which is just below the 50-day simple moving average ($8,262). If this support holds, the BTC/USD pair could remain range-bound between $8,130.58 and $10,000 for a few days.
The flattening 20-day exponential moving average ($9,073) and the relative strength index just below the midpoint indicates a balance between supply and demand. If the pair bounces off $8,130.58, it could offer a buying opportunity with a target objective of about $10,000.
Conversely, if the bears sink the pair below $8,130.58, it could signal the start of a downtrend.
ETH/USD
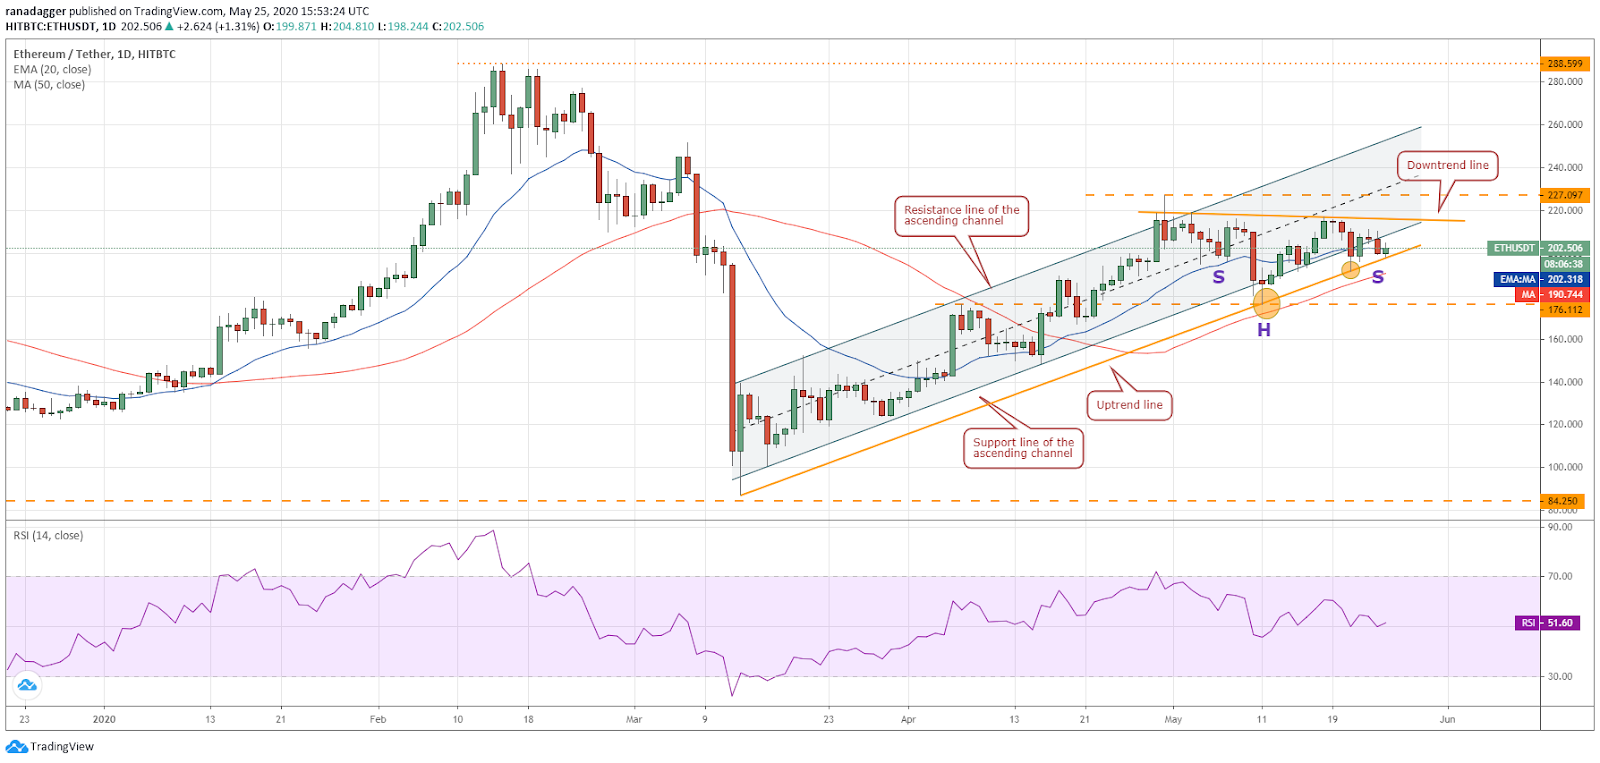
The bulls have not been able to keep Ether (ETH) inside the ascending channel, which is a negative sign. Currently, the bulls are attempting to defend the uptrend line, which had held twice before (marked via ellipses on the chart).
ETH–USD daily chart. Source: Tradingview
If the 2nd-ranked cryptocurrency on CoinMarketCap bounces off the uptrend line and closes (UTC time) above the downtrend line, it will complete an inverse head and shoulders pattern. This setup has a target objective of $257, which is close to the resistance line of the ascending channel. This could offer a buying opportunity to the traders.
Conversely, if the bears sink the ETH/USD pair below the uptrend line, a drop to $176.112 is possible. If this support holds, the pair might remain range-bound for a few days. The flat 20-day EMA and the RSI just above the 50 levels also point to a balance between supply and demand. A break below $176.112 will indicate the start of a new downtrend.
XRP/USD
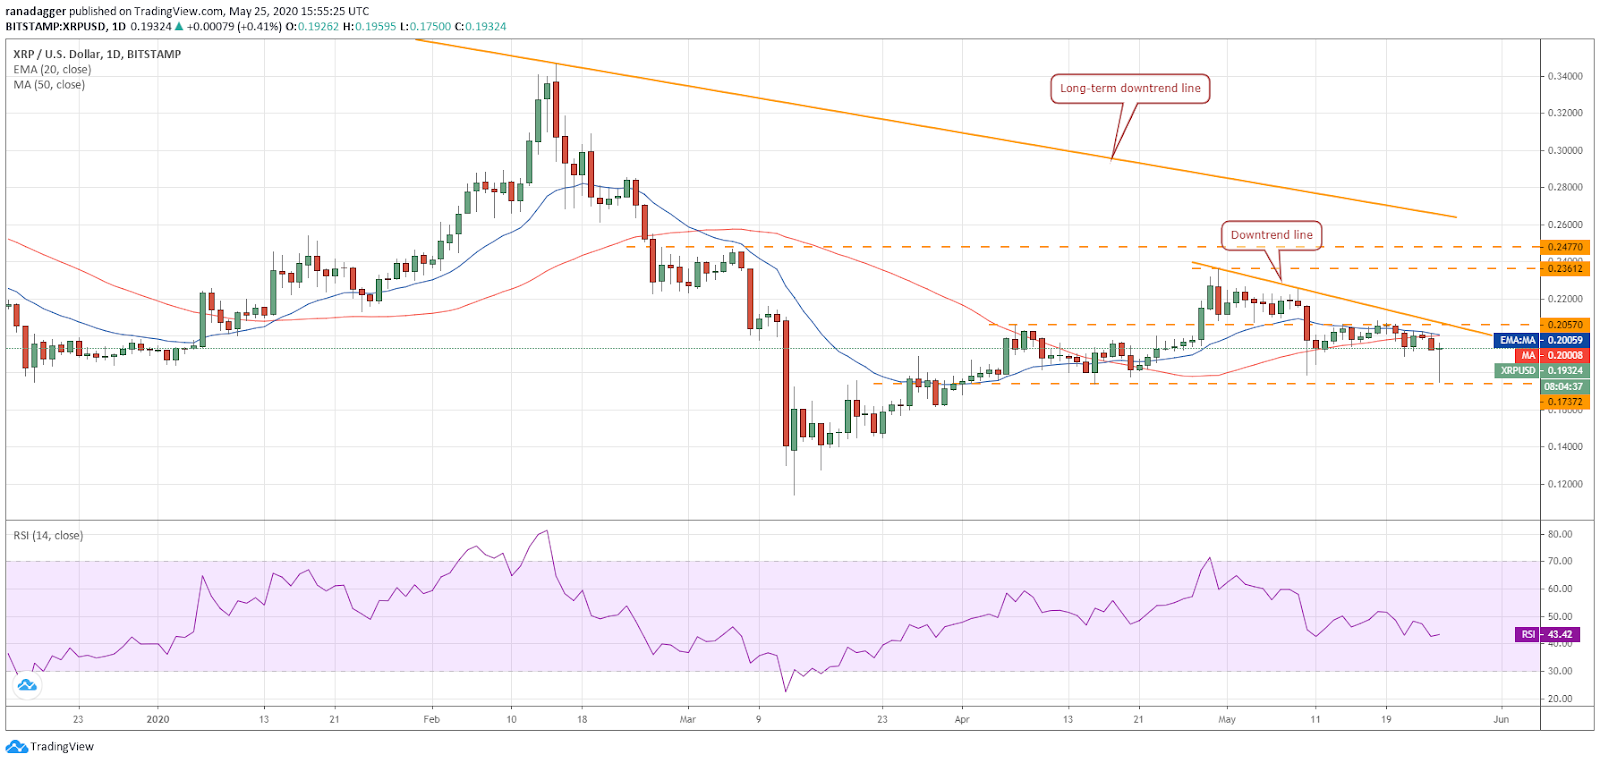
XRP turned down from the moving averages and plunged to $0.175 today. The strong bounce off this level suggests that the bulls are aggressively defending the critical support at $0.17372.
XRP–USD daily chart. Source: Tradingview
If the traders purchased the bounce off the support at $0.175 as suggested in the previous analysis, they can keep a stop-loss of $0.173.
The 3rd-ranked cryptocurrency on CoinMarketCap will show strength if the bulls can carry it above the downtrend line. Above this level, a move to $0.22504 and then to $0.23612 is possible. Traders can trail the stops higher as the price moves up.
Conversely, if the price turns down from the downtrend line and plummets below $0.17372, a drop to $0.14 is possible.
BCH/USD
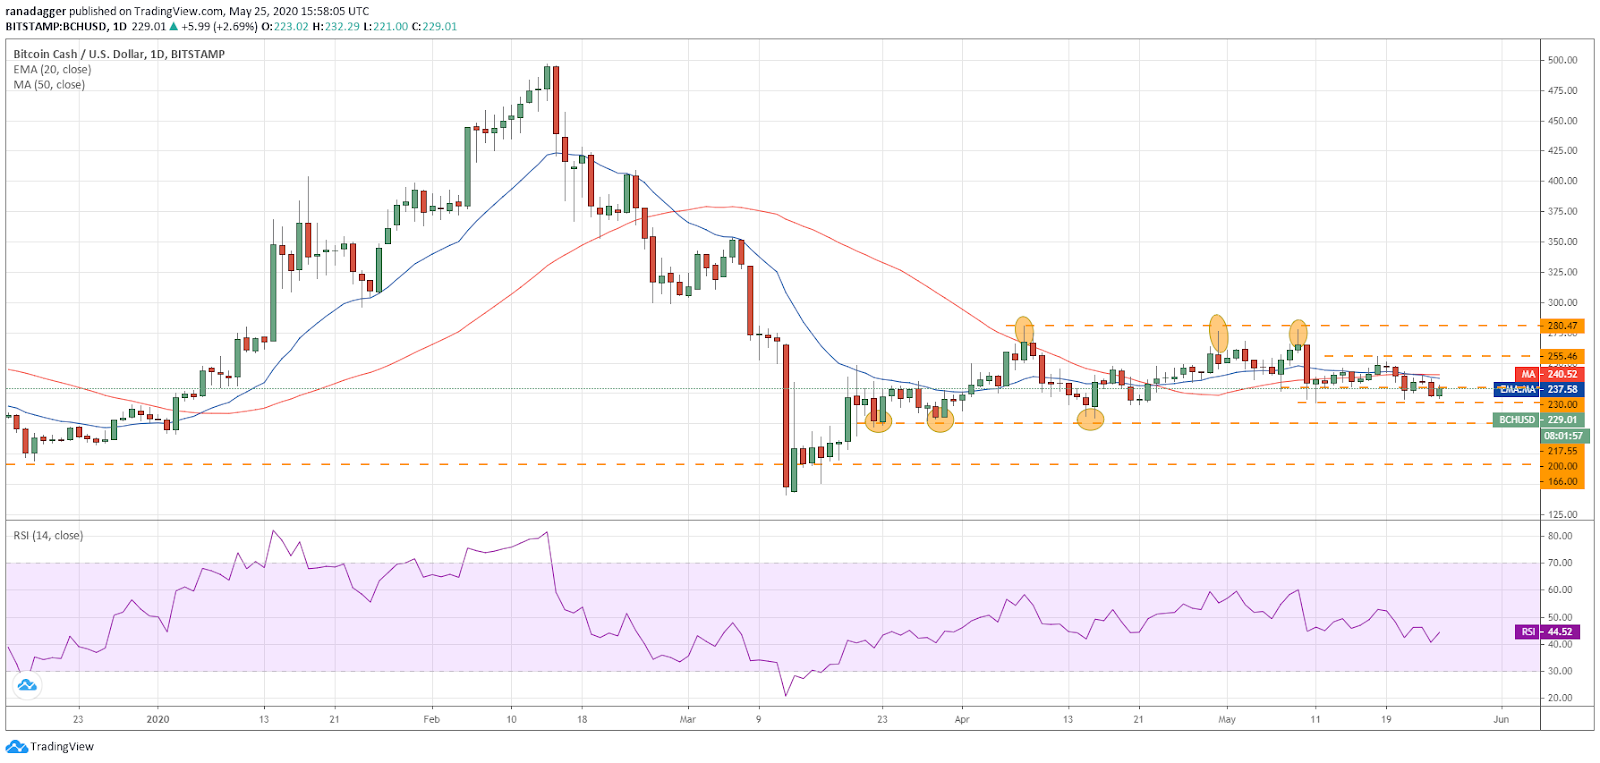
Bitcoin Cash (BCH) turned down from the moving averages on May 24 and dipped below the immediate support of $230. However, the bulls managed to keep the price above the next support at $217.55. This suggests some buying at lower levels.
BCH–USD daily chart. Source: Tradingview
The bulls will once again attempt to propel the 5th-ranked cryptocurrency on CoinMarketCap above the moving averages. If successful, a move to $255.46 is possible. A break out of this level can result in a rally to $280.47, which is likely to act as a strong resistance.
On the other hand, if the BCH/USD pair again turns down from the moving averages, it will increase the possibility of a fall to $217.55. This support has held thrice before, hence, a bounce off it can offer a buying opportunity with a tight stop-loss.
BSV/USD
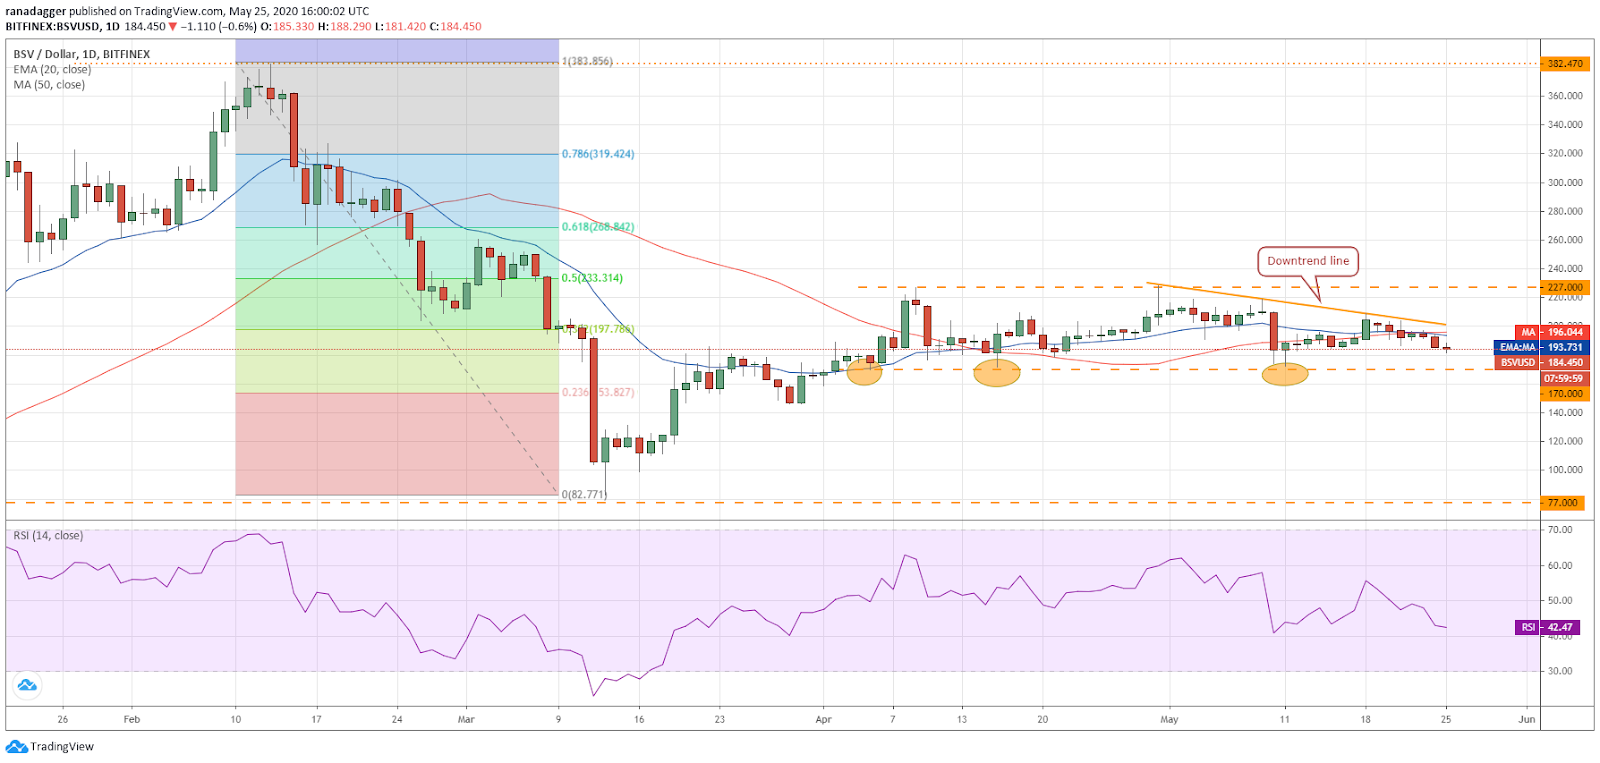
Bitcoin SV (BSV) turned down from the moving averages on May 24, which is a negative sign. The next support on the downside is $170. If this support cracks, it will signal the possible start of a new downtrend.
BSV–USD daily chart. Source: Tradingview
However, the bulls have defended the $170 level on three previous occasions, hence, a bounce off the support could offer a buying opportunity with a tight stop-loss.
If the bulls can drive the 6th-ranked cryptocurrency on CoinMarketCap above the downtrend line, a rally to $227 is possible. This is an important resistance from where the price has turned down twice before, hence, profits can be booked at this level.
LTC/USD
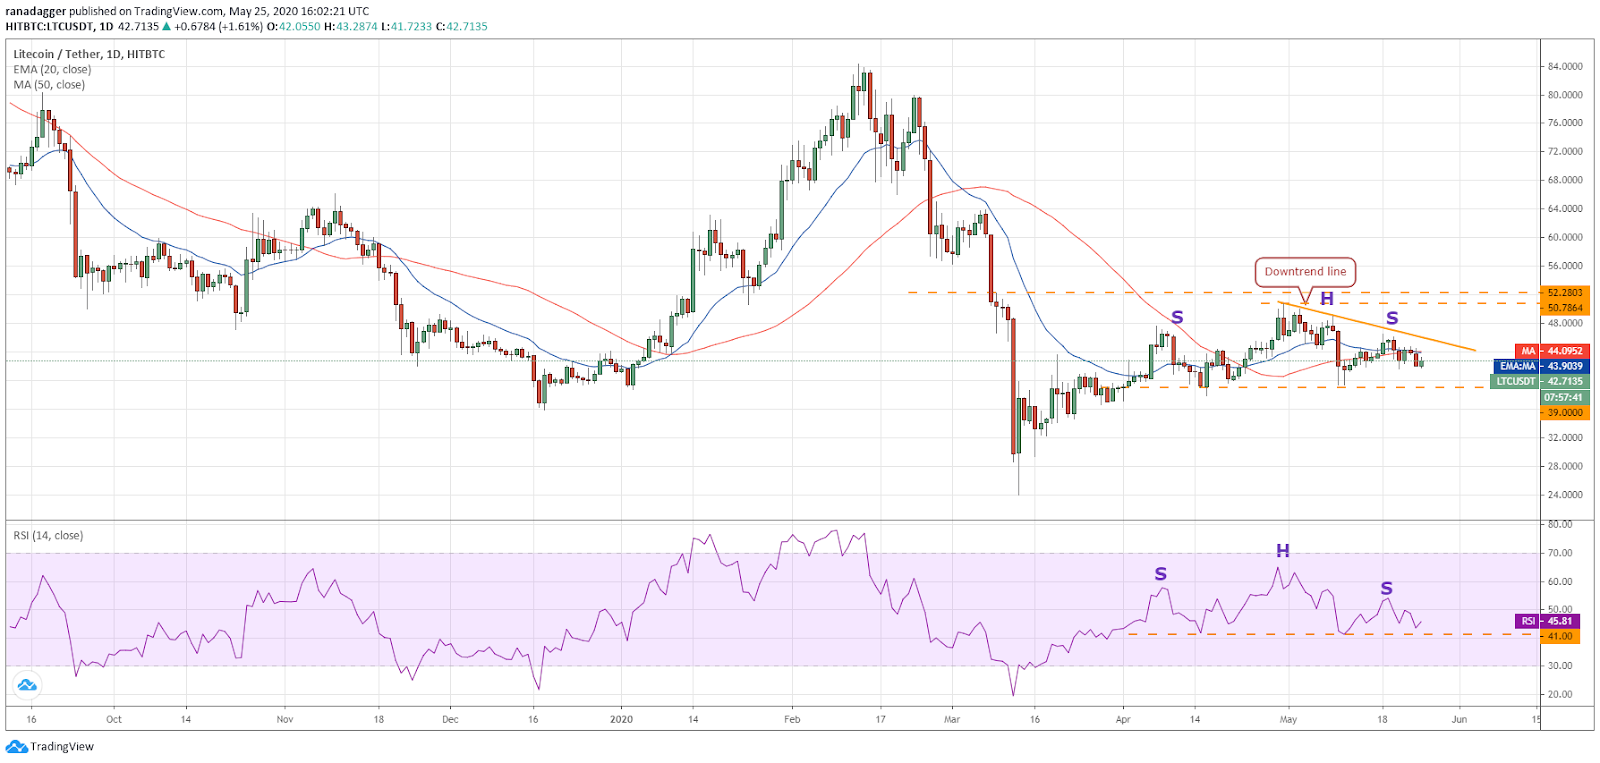
Litecoin (LTC) turned down from the moving averages on May 24, which is a negative sign. If the bulls do not push the price back above the moving averages within the next few days, it will increase the possibility of a head and shoulders breakdown.
LTC–USD daily chart. Source: Tradingview
The bearish setup will complete on a breakdown and close (UTC time) below $39. This could start a downtrend that has a target objective of $27.2136. The RSI has also formed a H&S pattern, which will complete on a break below 41 levels.
This bearish scenario will be invalidated if the 7th-ranked cryptocurrency on CoinMarketCap rebounds off the support at $39 and breaks above the downtrend line. Above this resistance, a rally to $50.7864 is possible. The LTC/USD pair is likely to pick up momentum on a close above $52.2803.
BNB/USD
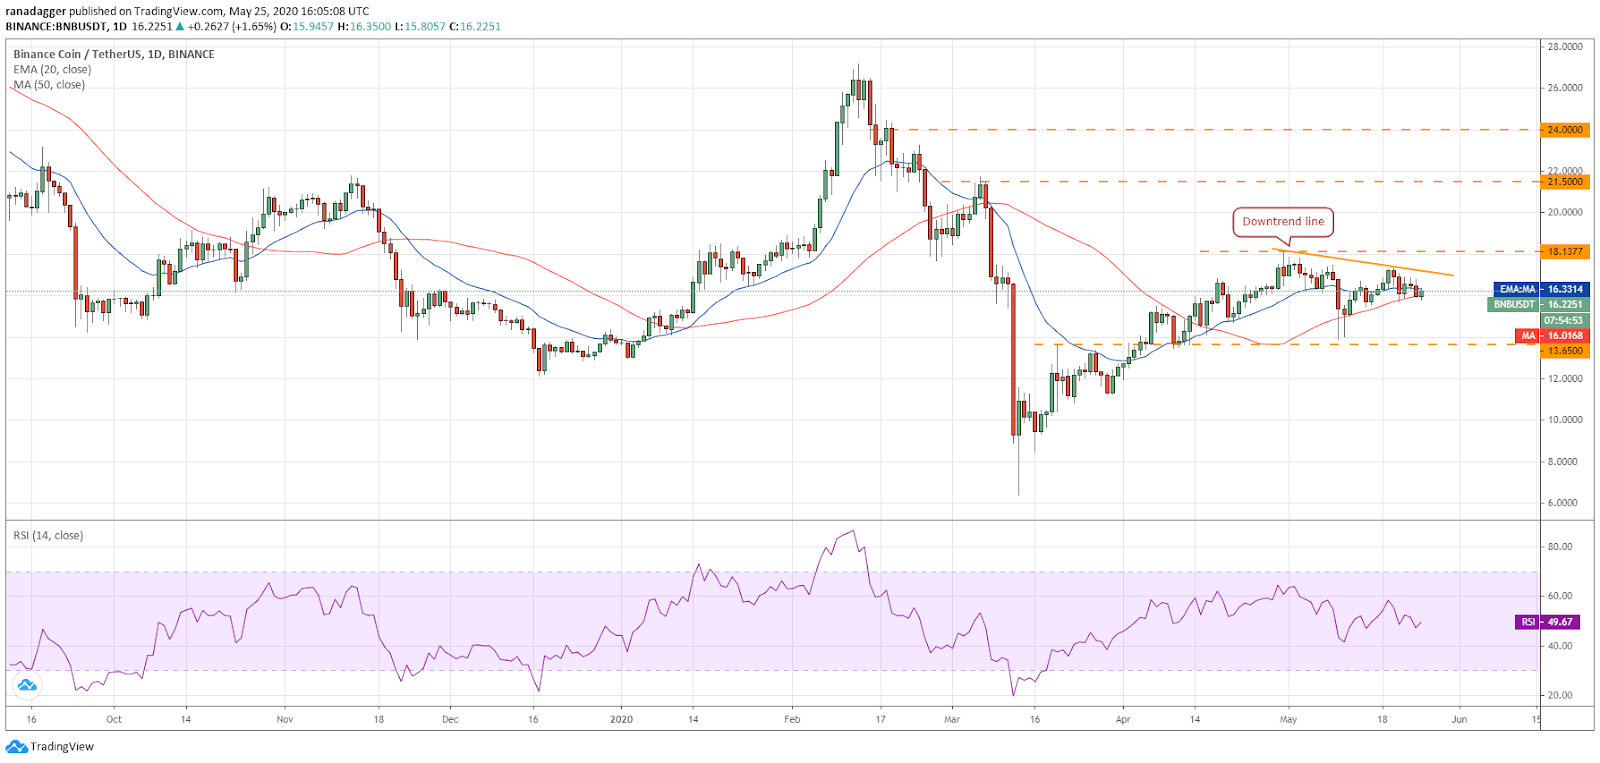
Binance Coin (BNB) has been holding the 50-day SMA ($16) for the past few days. This has become the critical support to watch out for. If the price bounces off this support, the bulls will make another attempt to scale the downtrend line.
BNB–USD daily chart. Source: Tradingview
If successful, a rally to $18.1377 is likely. A breakout of this resistance will signal the resumption of the uptrend. The next level to watch on the upside is $21.50. Hence, this could offer a buying opportunity.
Nonetheless, if the 8th-ranked crypto-asset on CoinMarketCap turns down from the current levels or from the downtrend line and breaks below the 50-day SMA, it could drop to $14.9586 and below it to $13.65. A break below this level will signal the start of a new downtrend.
EOS/USD
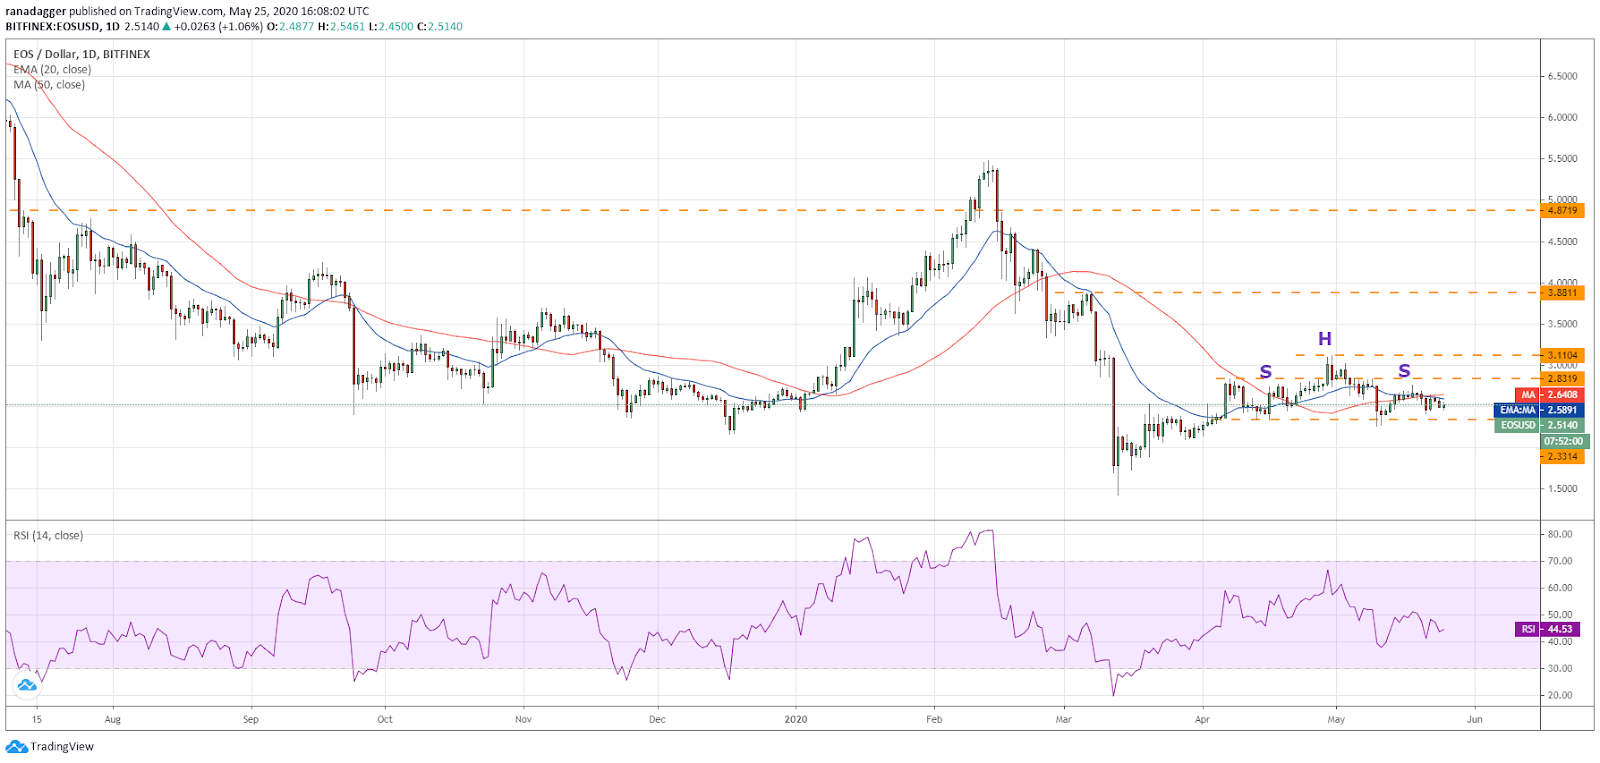
EOS has been trading below the moving averages for the past few days, which is a negative sign. The bears will now try to sink the price below the critical support at $2.3314.
EOS–USD daily chart. Source: Tradingview
The 20-day EMA ($2.59) has been sloping down and the RSI has been trading between 40-50 levels, which suggests that bears have a slight edge.
If the 9th-ranked cryptocurrency on CoinMarketCap closes (UTC time) below $2.3314, it will complete a H&S pattern. This setup has a target objective of $1.5524.
However, if the bulls defend the $2.3314 support once again and push the EOS/USD pair above the moving averages, a rally to $2.8319 is likely.
XTZ/USD
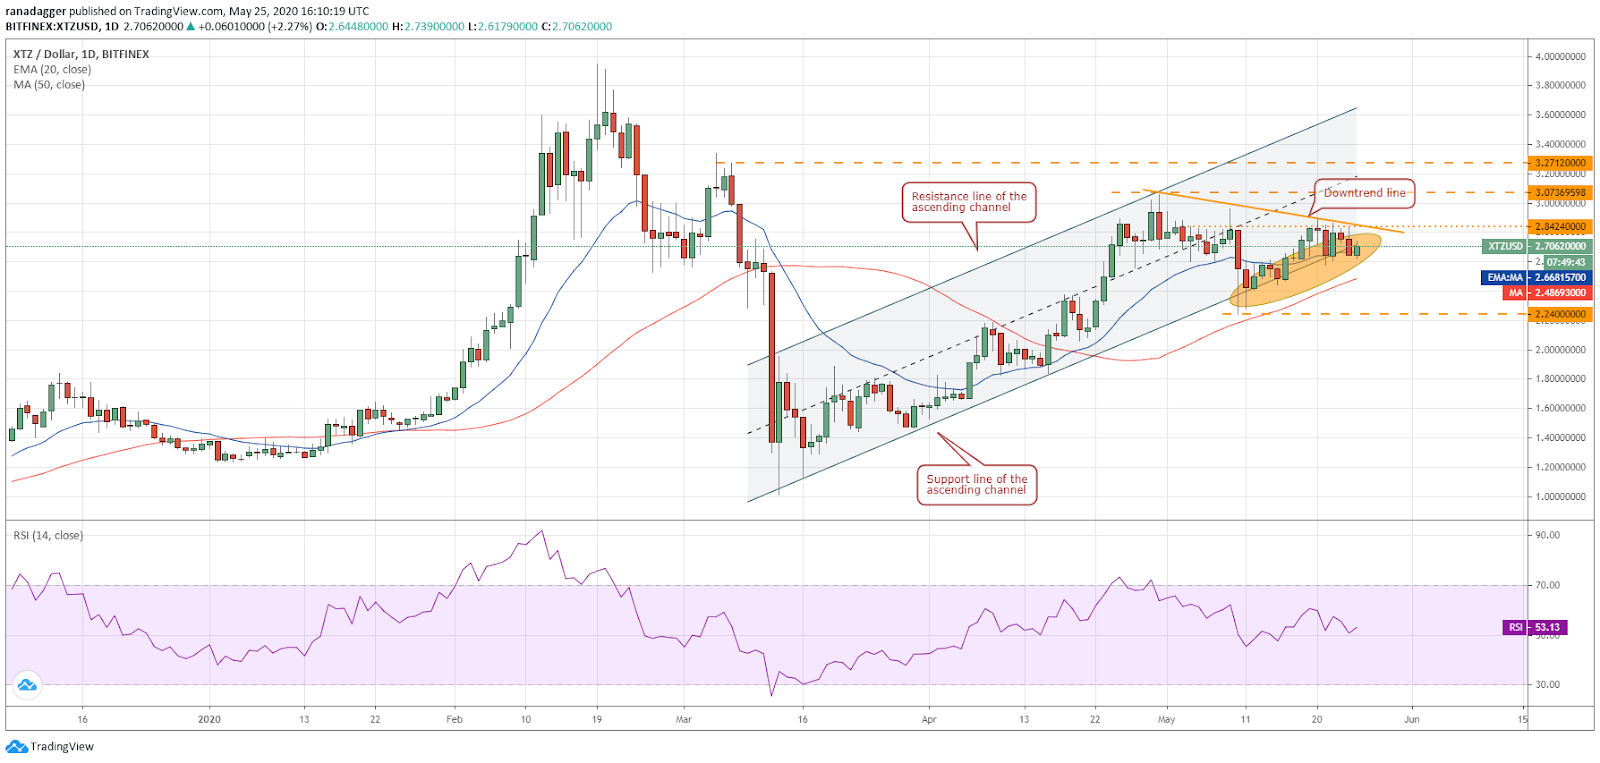
Tezos (XTZ) once again turned down from the downtrend line on May 24, which suggests that the bears are aggressively defending this level. In the past few days, the bears have repeatedly broken below the support line of the ascending channel.
XTZ–USD daily chart. Source: Tradingview
If the bears can sink the 10th-ranked cryptocurrency on CoinMarketCap below $2.5795, a drop to the 50-day SMA ($2.48) and below it to $2.24 is possible. A break below this level could start a new downtrend.
Conversely, if the bulls can push the XTZ/USD pair above the downtrend line, it will signal strength. Above this level, a rally to $3.07369 and then to $3.2712 is possible. Hence, a breakout and close (UTC time) above the downtrend line can be viewed as a buying opportunity.
ADA/USD
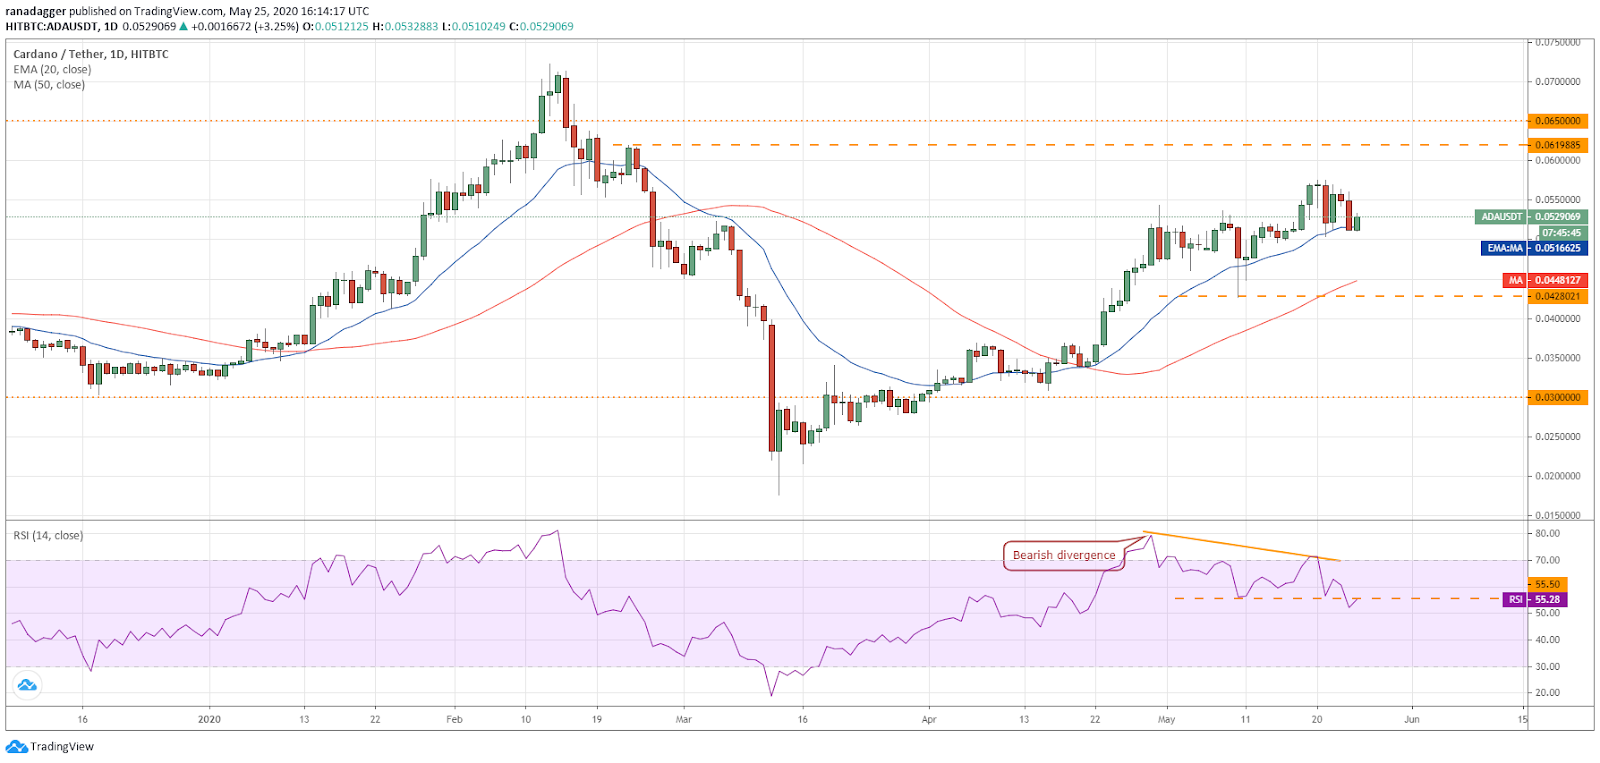
The bulls have been attempting to defend the 20-day EMA ($0.05166) for the past few days. While this is a positive sign, repeated retests of a support weaken it. Therefore, if Cardano (ADA) does not rise above $0.0575409 within the next few days, a deeper correction is likely.
ADA–USD daily chart. Source: Tradingview
If the bears sink and sustain the 11th-ranked cryptocurrency on CoinMarketCap below the 20-day EMA, a drop to the 50-day SMA ($0.04481) is possible. A break below the critical support of $0.0427288 will signal the start of a downtrend.
The 20-day EMA is flattening out and the RSI has dipped close to the midpoint, which suggests a range-bound action for a few days.
Conversely, if the ADA/USD pair bounces off the current levels and breaks out of $0.0575409, the uptrend is likely to resume.
The views and opinions expressed here are solely those of the author and do not necessarily reflect the views of Cryptox. Every investment and trading move involves risk. You should conduct your own research when making a decision.
Market data is provided by HitBTC exchange.

