Retail traders capitulated as Bitcoin and Ether dropped to multi-month lows and technical indicators suggest the markets could remain volatile over the next few days.
Bitcoin’s (BTC) massive bloodbath on May 19 resulted in panic selling across the board. Several major altcoins nosedived between 25% to 50% during the day. The extent of the fall shows that many large traders may have dumped their positions and leverage traders may have been roasted.
In a report to its clients on Tuesday, JPMorgan Chase analysts pointed out that institutional investors were abandoning Bitcoin in favor of gold. Considering the volatility ratio of Bitcoin to gold, JP Morgan believes Bitcoin’s current fair value is $35,000.
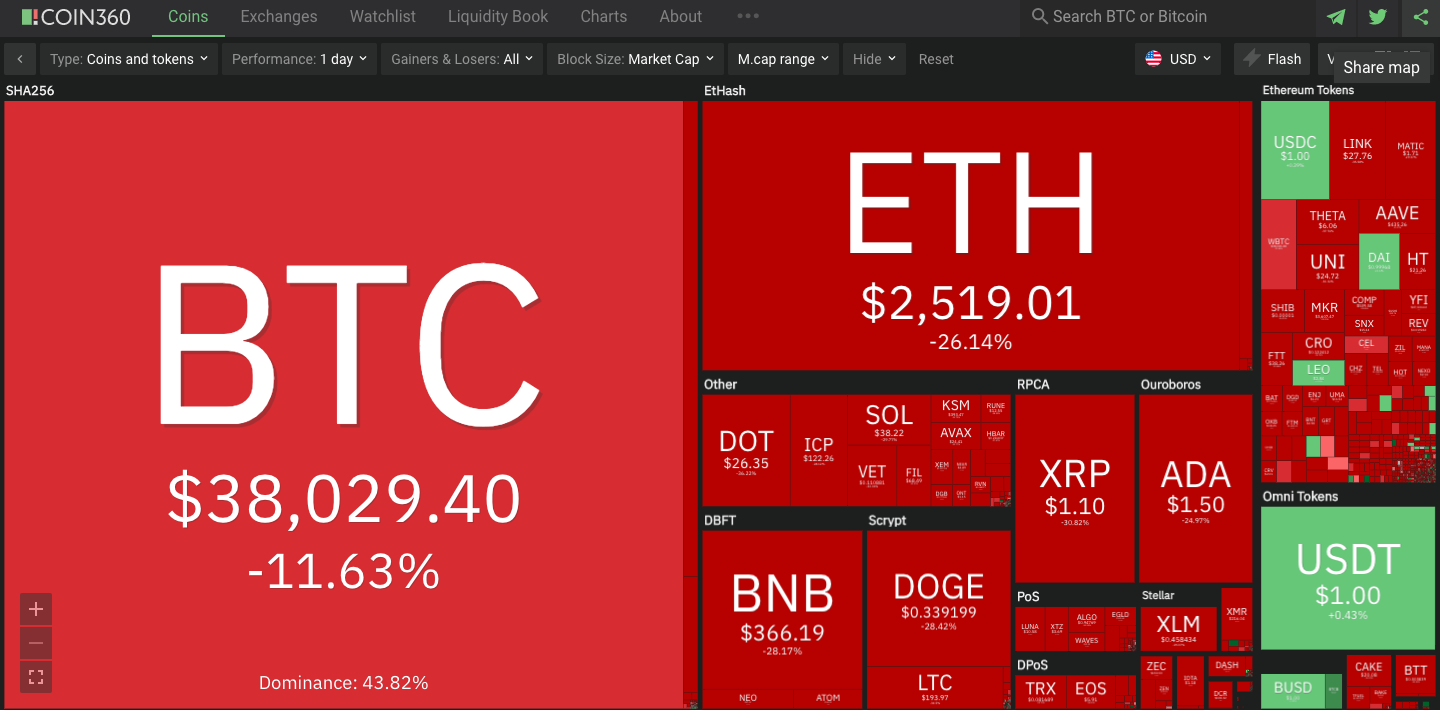
The massive fall today is likely to scare several institutional investors and delay their entry into the space. Although there will be periodic rebounds and sharp bear rallies, the next bull run may not start in a hurry.
Galaxy Digital founder Mike Novogratz also told CNBC that the decline feels like capitulation and this breakdown may not be fixed quickly.
After the sharp decline and the subsequent rebound, let’s analyze the charts of the top-10 cryptocurrencies to determine the support and resistance levels.
BTC/USDT
Bitcoin’s close below the neckline on May 17 completed the bearish head and shoulders pattern. The buyers attempted to push the price back above the neckline on May 18 but failed as seen from the long wick on today’s candlestick.
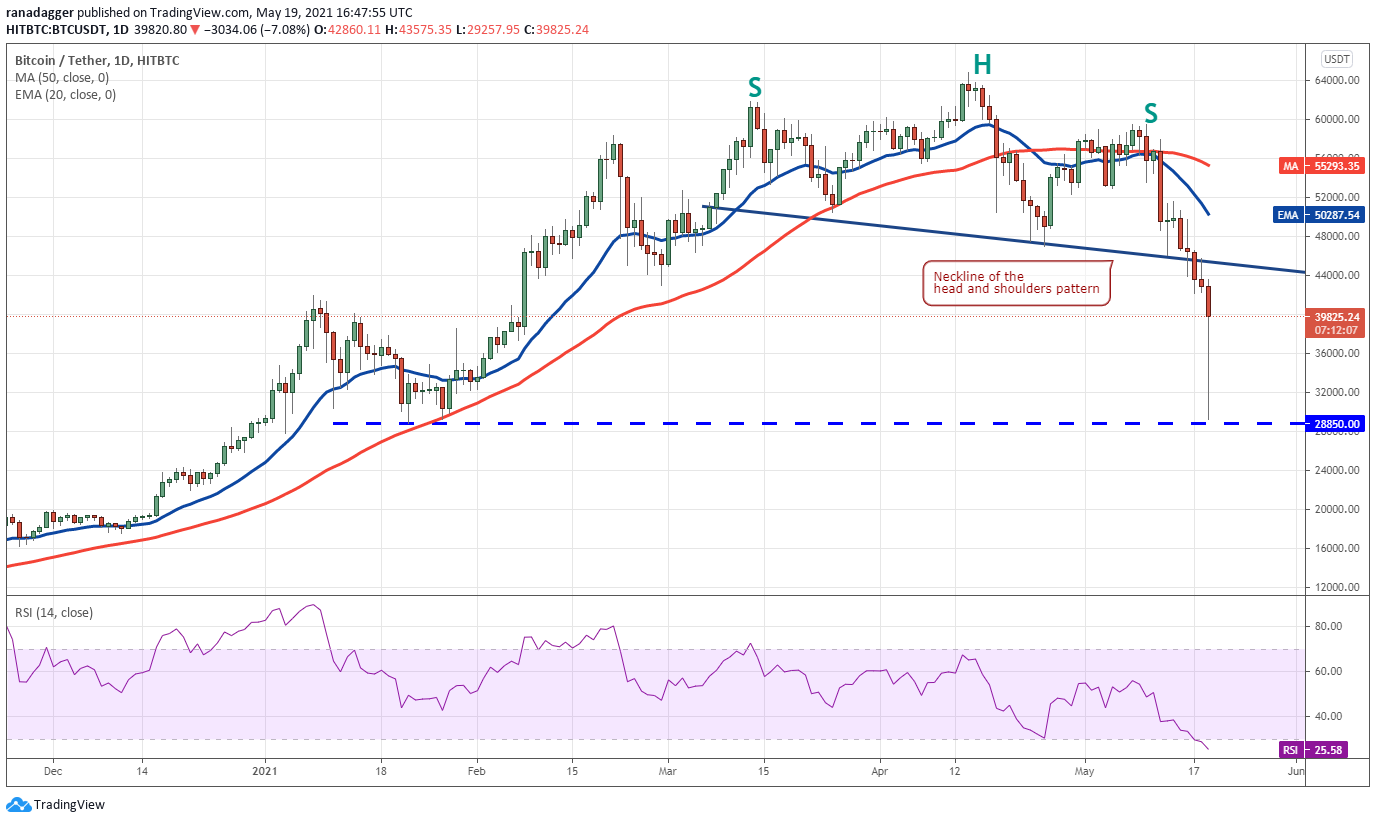
The selling picked up momentum today and turned into capitulation as the BTC/USDT pair plunged to $29,257.95, exceeding the H&S pattern target at $31,653.73. This fall has pushed the relative strength index (RSI) deep into the oversold territory for the first time since March 2020.
Generally, after such a sharp fall, a pullback can be expected because traders who initiated short positions at higher levels may book profits and aggressive bulls may have purchased near the critical support at $28,850.
The long tail on the candlestick suggests strong buying on dips but the rise from the current levels may not be easy because the bulls are likely to encounter massive supply at the neckline. If the price turns down from this resistance, the pair could consolidate in a large range between $28,850 and $44,000 for the next few days.
ETH/USDT
Ether (ETH) broke below the 50-day simple moving average ($2,760) and the 61.8% Fibonacci retracement level at $2,467.78 today. This resulted in panic selling and the biggest altcoin plummeted below the 78.6% retracement at $1,949.41 to hit an intraday low at $1,801.60.
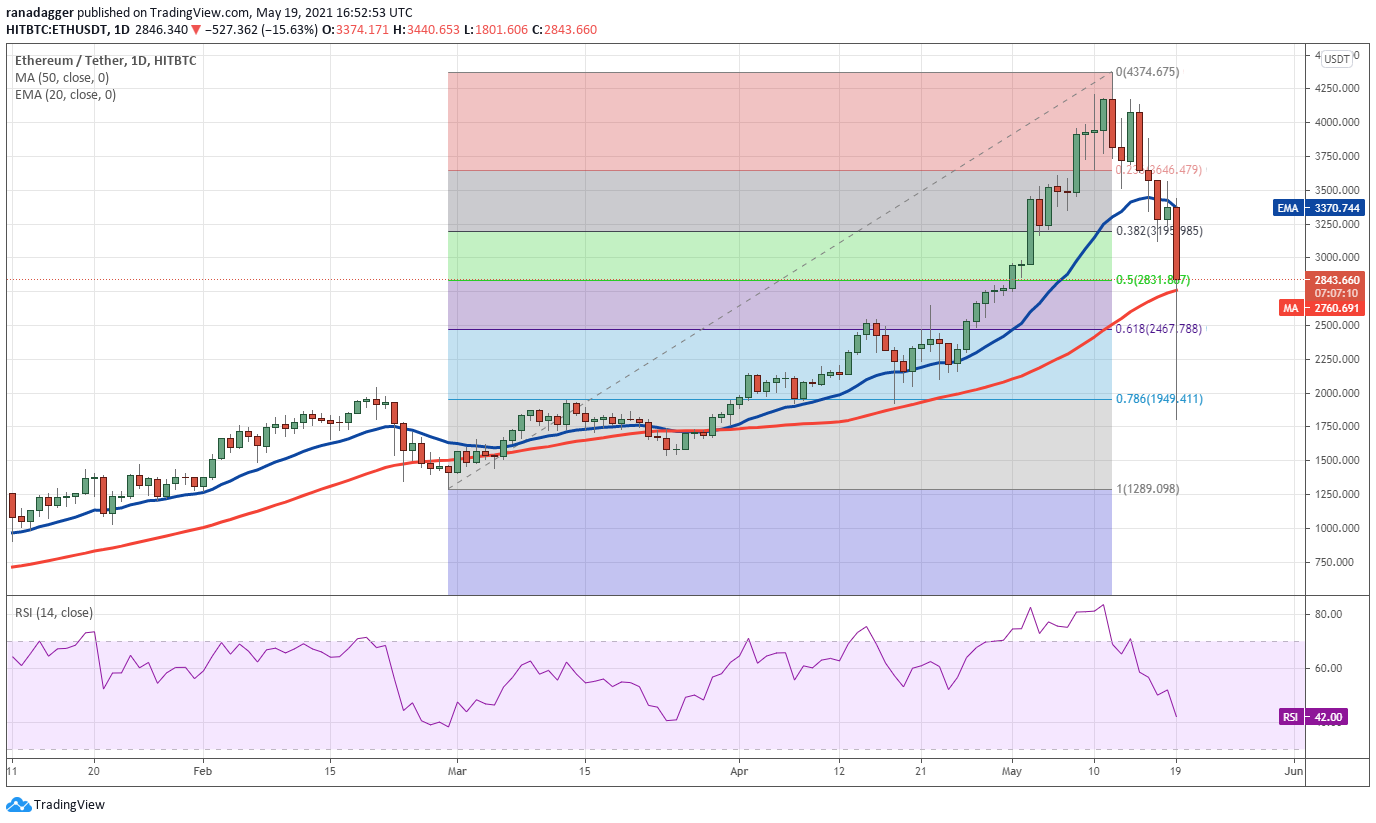
However, a minor positive is that buyers have aggressively bought the dip as seen from the long tail on the candlestick. If the bulls can sustain the price above the 50-day SMA, the ETH/USDT pair could rally to the 20-day exponential moving average ($3,370). This move is likely to attract selling from the bears because the sentiment has turned negative.
If the price turns down from the 20-day EMA, the pair may drop to the 50-day SMA. If this level holds, the pair may consolidate between the moving averages.
On the other hand, if the bears sink the price below the 50-day SMA, the pair may gradually drop to $1,801.60. If this level holds, the pair could remain range-bound for a few days. However, if the bears sink the price below $1,801.60, the down move may reach $1,289.09.
BNB/USDT
The buyers defended the $480 support on May 17 and 18 but the incessant selling today dragged Binance Coin (BNB) to $280. With today’s decline, the altcoin came close to a 100% retracement of the bull run that started from $233.81 on March 26.
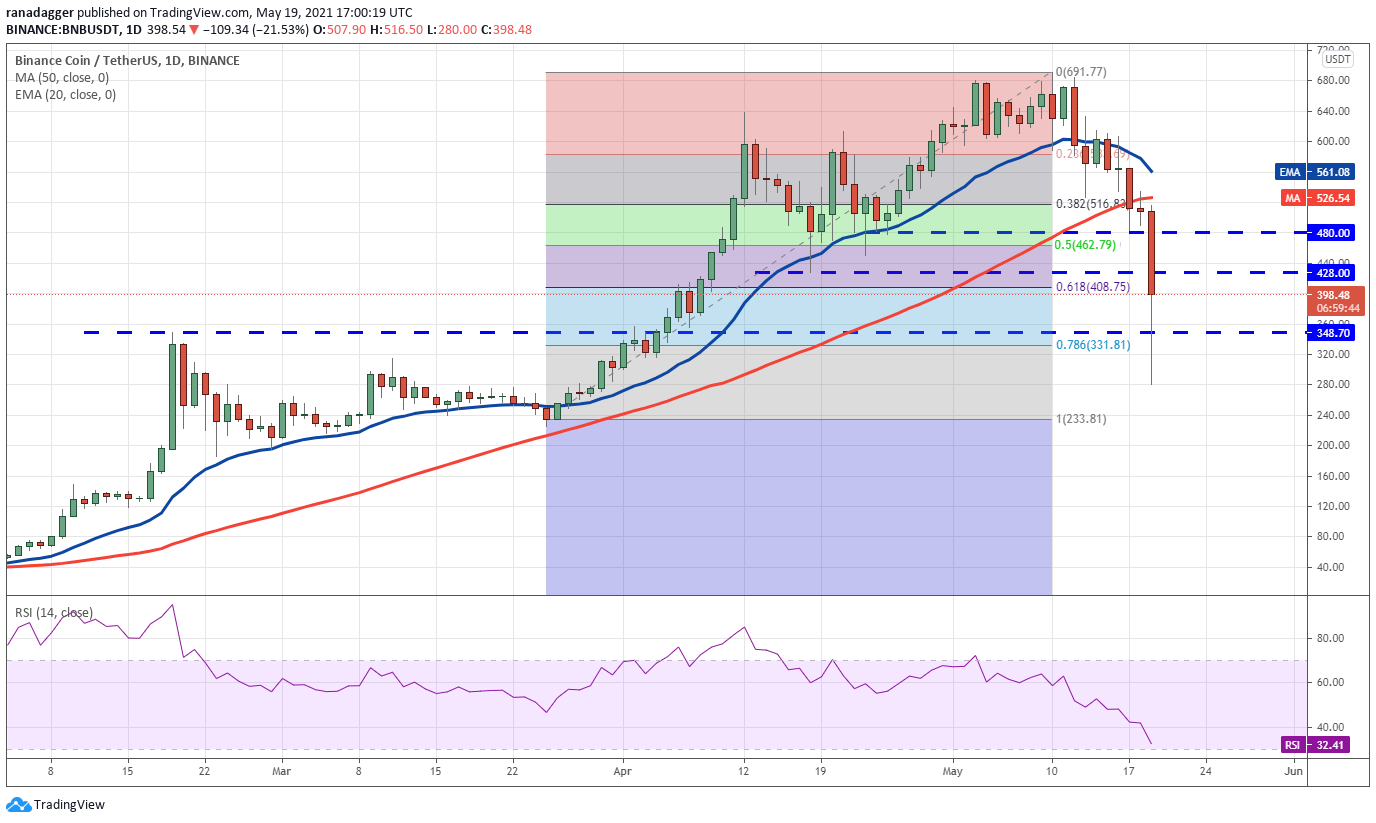
The moving averages are on the verge of a bearish crossover, indicating the trend has changed from bullish to bearish. Any relief rally from the current level is likely to face stiff resistance at $428 and again at $480.
If the price turns down from either level, the BNB/USDT pair may retest $233.81. If this level also gives way, the next support is at $186.10. The bulls are likely to defend this zone aggressively.
ADA/USDT
Cardano (ADA) formed an inside-day candlestick pattern on May 18, which showed indecision among the bulls and the bears. The uncertainty resolved to the downside today, resulting in a massive long liquidations by the bulls.
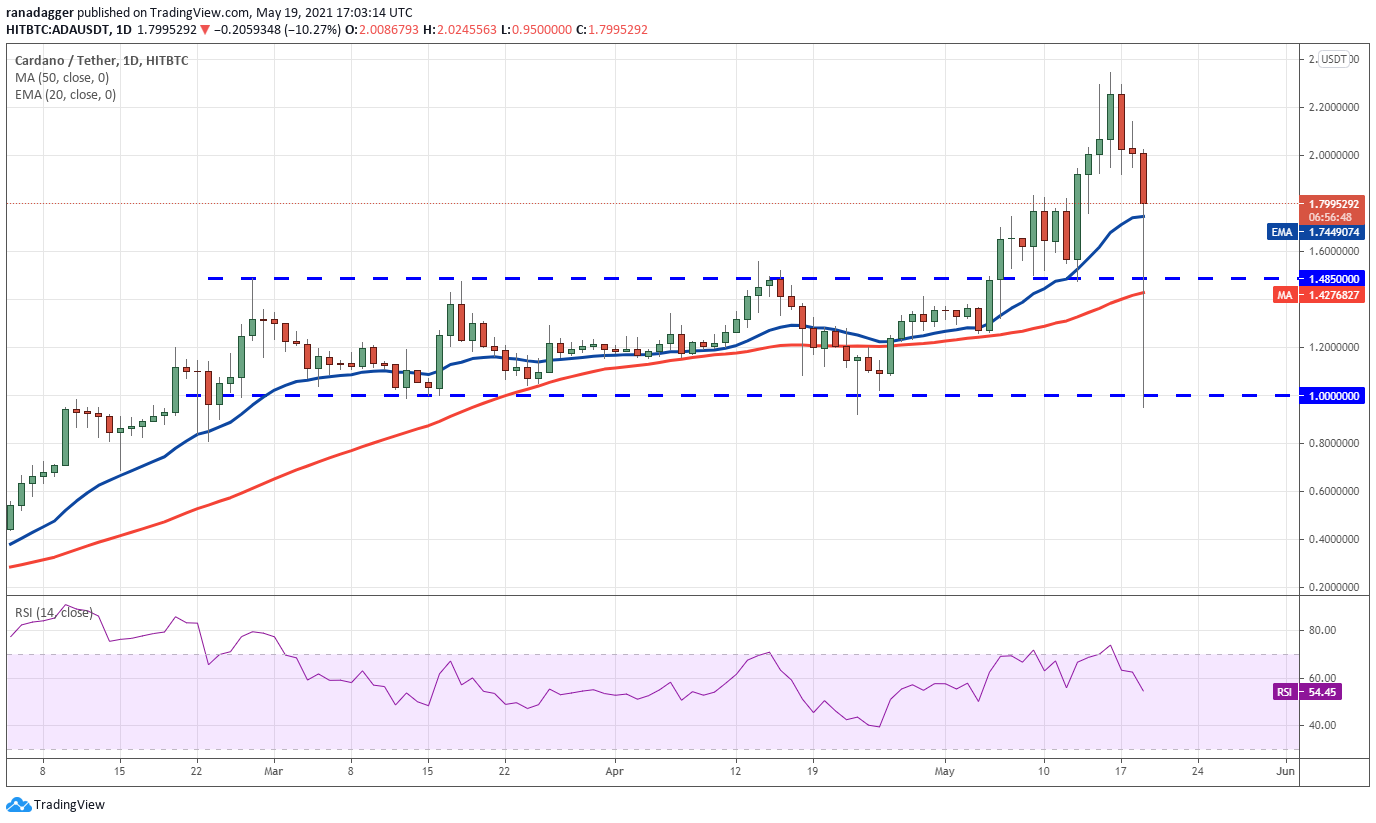
The capitulation pulled the ADA/USDT pair down to $0.95 today, its lowest level since April 23. However, the bulls have purchased the dip aggressively as seen from the long tail on the day’s candlestick.
If the bulls can sustain the price above the 20-day EMA ($1.74), it will suggest strong demand at lower levels. The pair may then consolidate between $1.48 and $2 for a few days. Conversely, if the price turns down and breaks below $1.48, the pair could gradually drop to $1.
DOGE/USDT
Although Dogecoin (DOGE) sustained above the 20-day EMA ($0.46) for the past few days, the bulls could not achieve a strong rebound. This showed a lack of demand at higher levels.
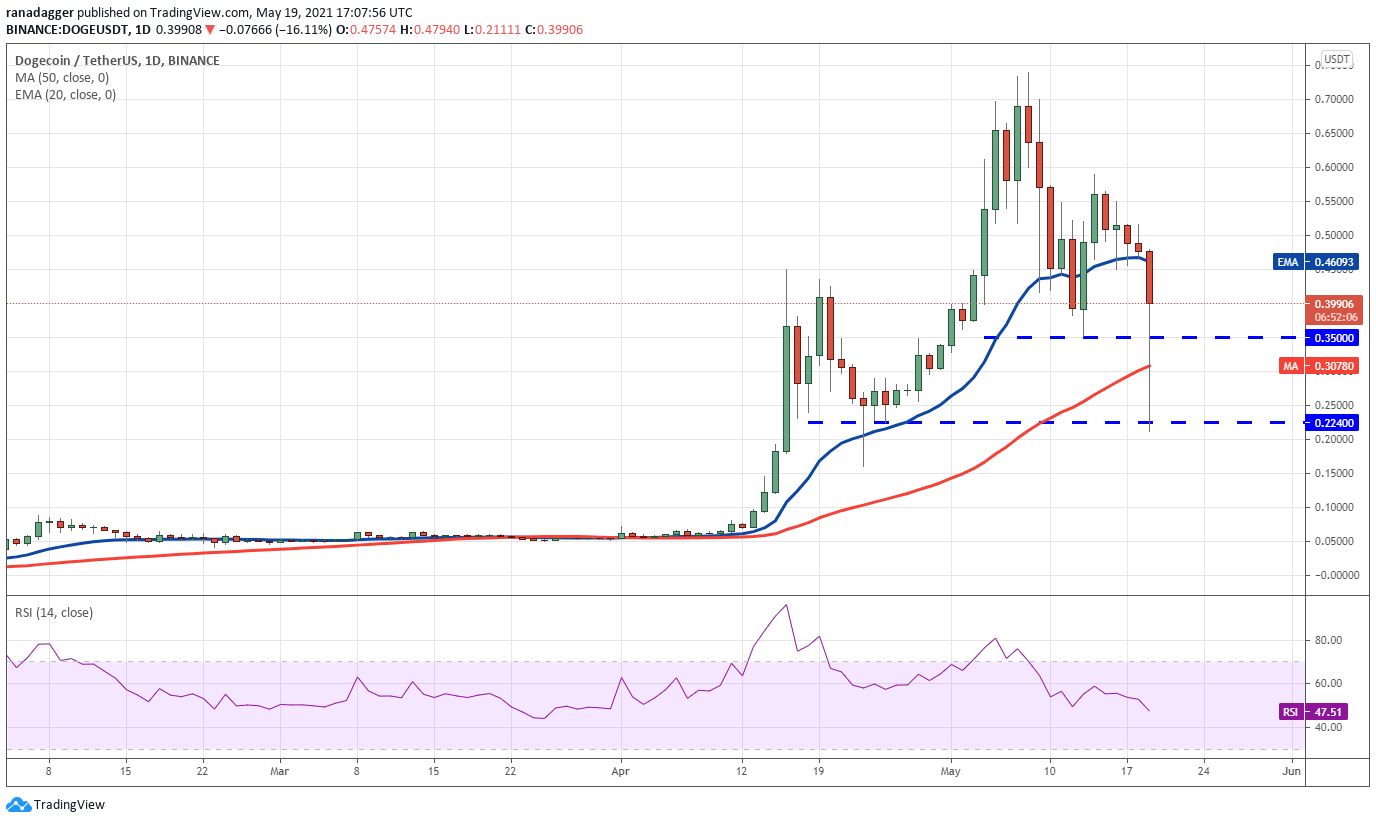
The DOGE/USDT pair broke below the 50-day SMA ($0.30) and hit an intraday low at $0.21. The bulls have purchased the dip aggressively as seen from the long tail on the day’s candlestick.
If the bulls can sustain the price above $0.35, the pair could rise to the 20-day EMA. This level is likely to attract selling and the pair may then remain range-bound between the moving averages for a few days.
XRP/USDT
XRP pierced the resistance line of the symmetrical triangle on May 18 but the long wick on the candlestick suggests the bulls could not sustain the breakout. The price reversed direction today and plummeted below the support line of the triangle, which may have resulted in huge long liquidations.
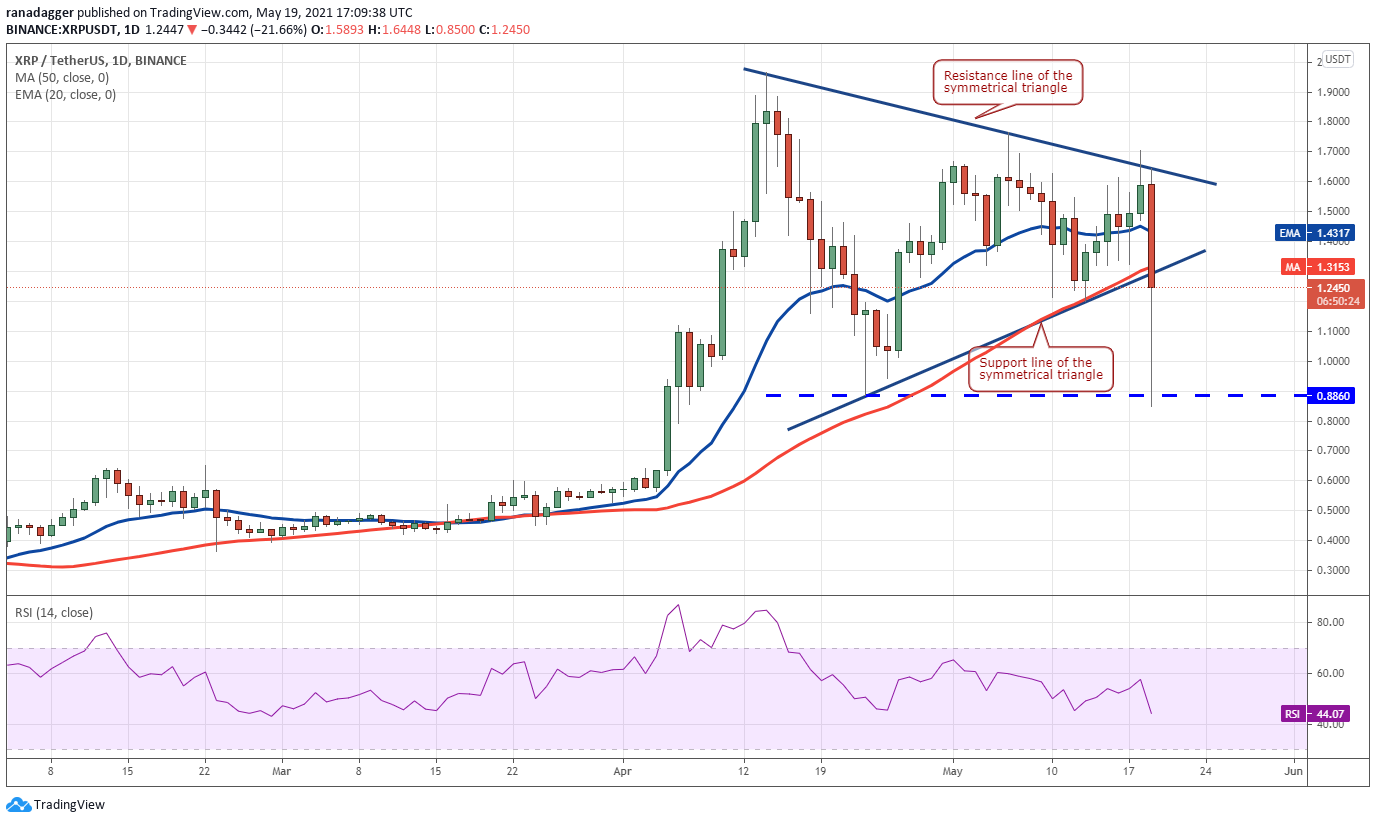
However, the long tail on today’s candlestick suggests the bulls purchased the dip to the critical support at $0.88. The buyers will now try to push the price back into the triangle but they are likely to face stiff resistance at the moving averages.
If the price turns down from the 50-day SMA ($1.31), the XRP/USDT pair could again gradually drop to $0.88. If the support holds, the pair may consolidate between $1.20 and $0.88 for a few days.
DOT/USDT
Polkadot (DOT) attempted to take support at the moving averages on May 18 but the demand fizzled out at $42.59. The altcoin turned down today and deep dived to $18, the lowest level since Feb. 3.
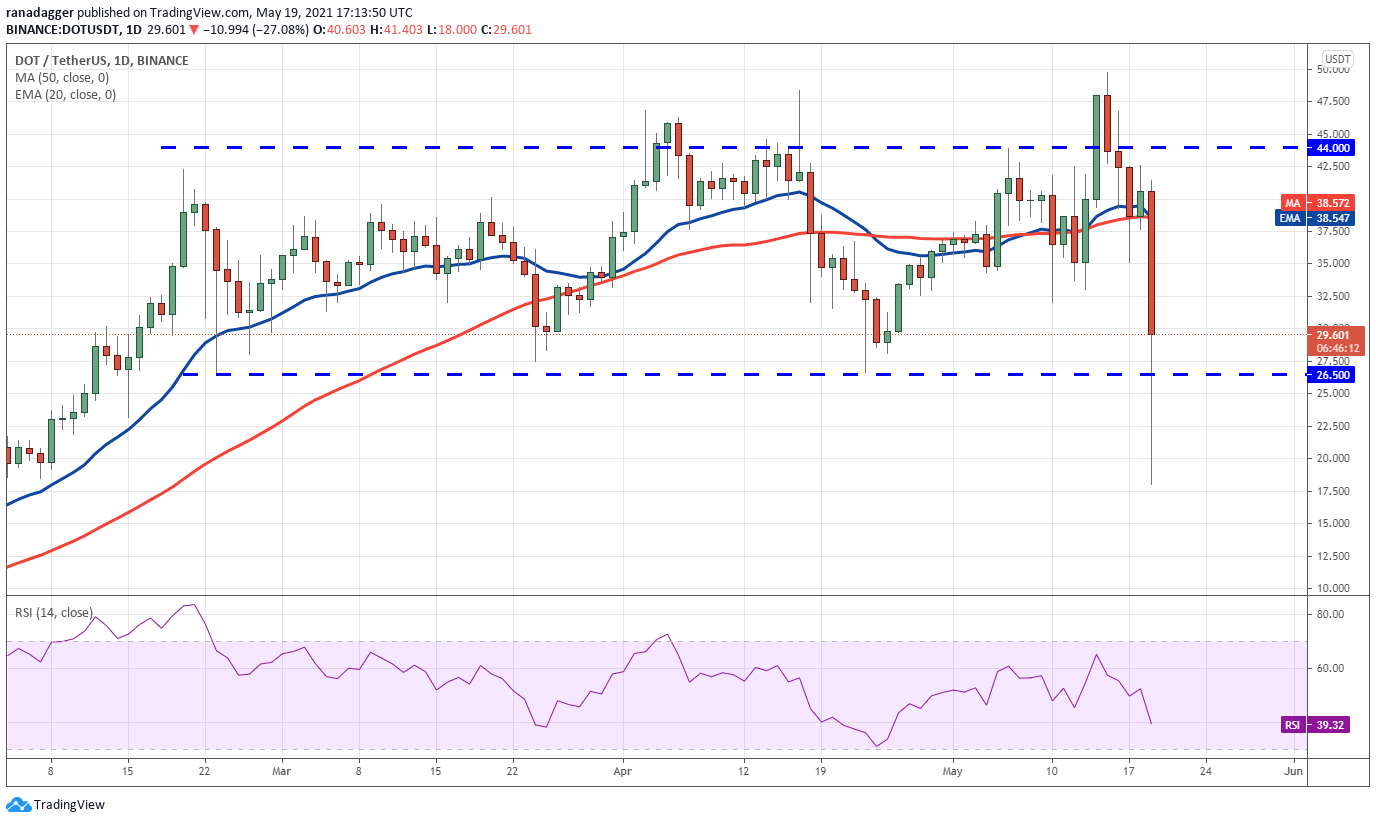
If the price closes below $26.50, the bears may continue to pound the DOT/USDT pair and retest the $18 support.
On the contrary, if the relief rally sustains above $26.50, it will suggest the capitulation may be over. The pair could then gradually move up to $32.50 and then to the moving averages.
If the price turns down from the overhead resistance but stays above $26.50 during the next decline, a range-bound action may ensue.
BCH/USDT
Bitcoin Cash (BCH) attempted at recovery on May 18 but could not rise above the 20-day EMA ($1,134). The long wick on the day’s candlestick showed that traders are selling on rallies to stiff resistance levels.
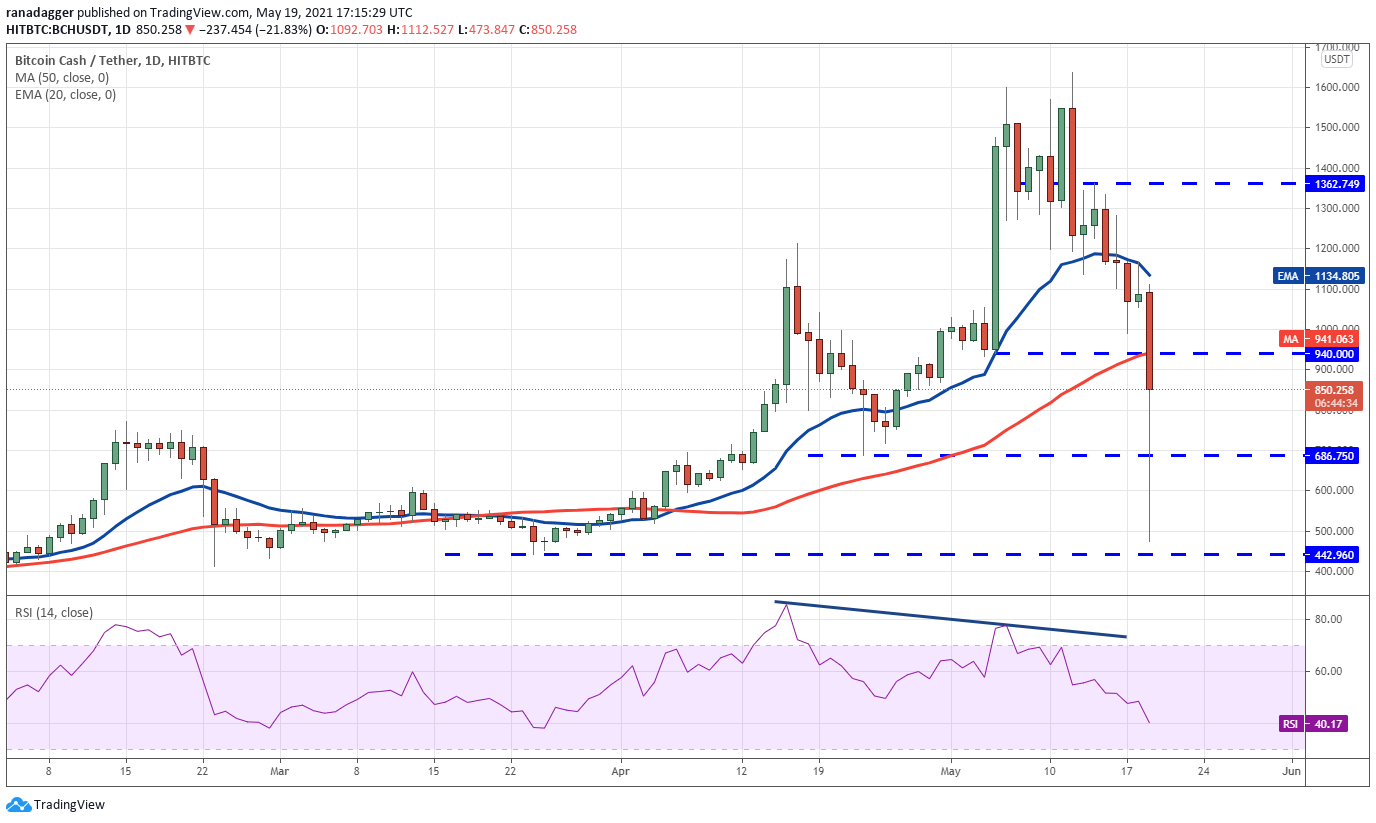
The selling picked up momentum after the BCH/USDT pair broke below $940 and the next critical support at $686.75. The pair finally hit an intraday low at $473.84, its lowest level since March 26.
Aggressive bulls seem to have purchased at lower levels, resulting in a strong recovery as seen from the long tail on the candlestick.
However, the relief rally is likely to hit a hurdle near $940. If the price turns down from this resistance, the pair could consolidate in a large range between $442.96 and $940 for the next few days.
LTC/USDT
The bulls defended the 50-day SMA ($272) on May 17 but they could not extend the recovery above the 20-day EMA ($299) on May 18. This suggests that traders sold their Litecoin (LTC) positions during the relief rally.
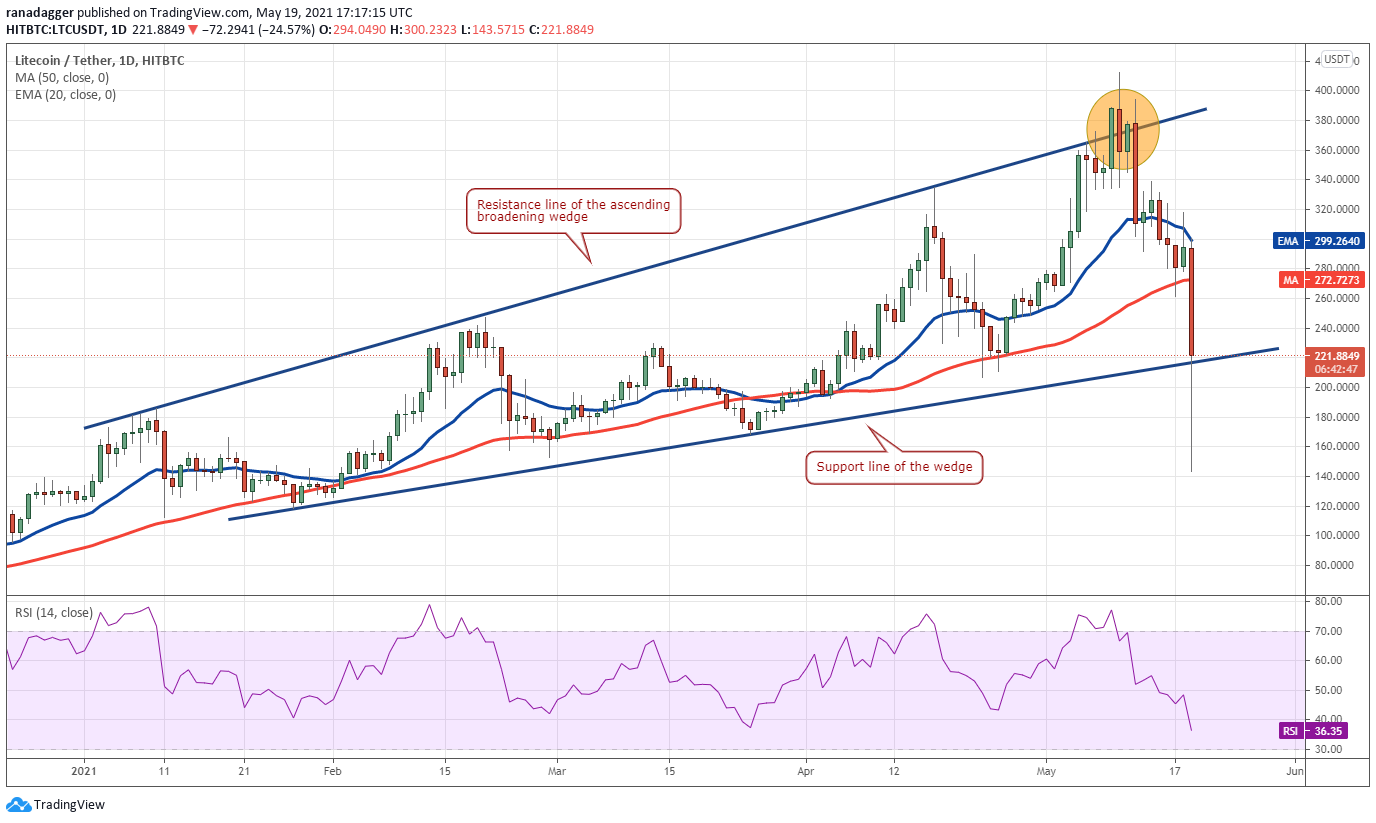
Today, the selling resumed and the LTC/USDT pair plunged below the 50-day SMA and the support line of the broadening wedge pattern. This may have resulted in panic selling, dragging the price down to $143.57, the lowest level since Feb. 05.
If the price closes below the support line, the bears may resume selling and a retest of $143.57 may be on the cards. Conversely, if the price climbs back into the wedge, the pair may rise to the moving averages where it is again likely to encounter selling from the bears.
UNI/USDT
Uniswap (UNI) broke below the support line of the ascending channel on May 17 but the bulls pushed the price back into the range on May 18. However, the buyers could not clear the hurdle at the 20-day EMA ($36), indicating selling at higher levels.
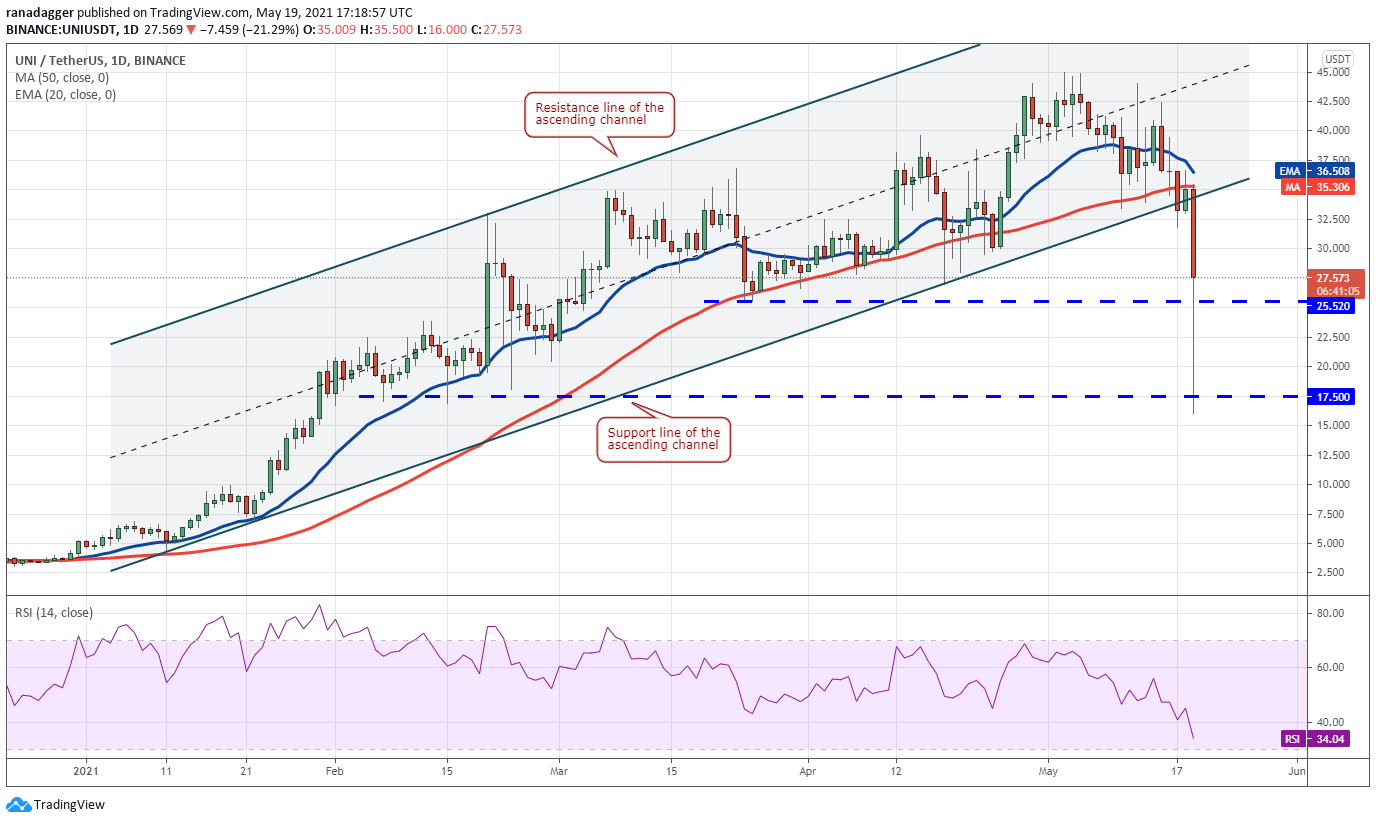
The UNI/USDT pair turned down today and broke below the support line of the channel. The selling picked up momentum after the $25.52 support cracked. This may have caused long liquidation, resulting in a drop to an intraday low at $16.
However, the positive sign is that the bulls purchased this dip and are attempting to start a relief rally. This rally may face stiff resistance at $30 and then again at the moving averages. If the price turns down from this resistance, the pair may drop to $25.52 and remain range-bound for a few days.
Alternatively, if the price closes below $25.52, the bears may try to build on their advantage and sink the price to $16.
The views and opinions expressed here are solely those of the author and do not necessarily reflect the views of Cryptox. Every investment and trading move involves risk. You should conduct your own research when making a decision.
Market data is provided by HitBTC exchange.


