The impending launch of Bakkt could likely determine the price of Bitcoin for the next few weeks.
Many central banks across the world are racing against each other to devalue their currencies. Crypto fund executive Travis Kling believes that Bitcoin (BTC) is a great hedge against irresponsible monetary and fiscal policies of central banks and governments.
Tim Draper has said that his target price of $250,000 for Bitcoin is conservative because at that price, the leading cryptocurrency will have only about 5% market share of the currency world, which may be understating the importance and power of Bitcoin. He said that, as the adoption of Bitcoin among the masses increases, the price will skyrocket higher.
In the short term, we believe that the launch of Bitcoin futures trading at Bakkt will determine the price of the leading cryptocurrency. We expect a large move in Bitcoin, which will set the direction for the next few weeks. Meanwhile, a few altcoins have started to show signs of life at lower levels. So, is this a good time to buy or is this only a dead cat bounce that will fizzle out? Let’s analyze the charts.
BTC/USD
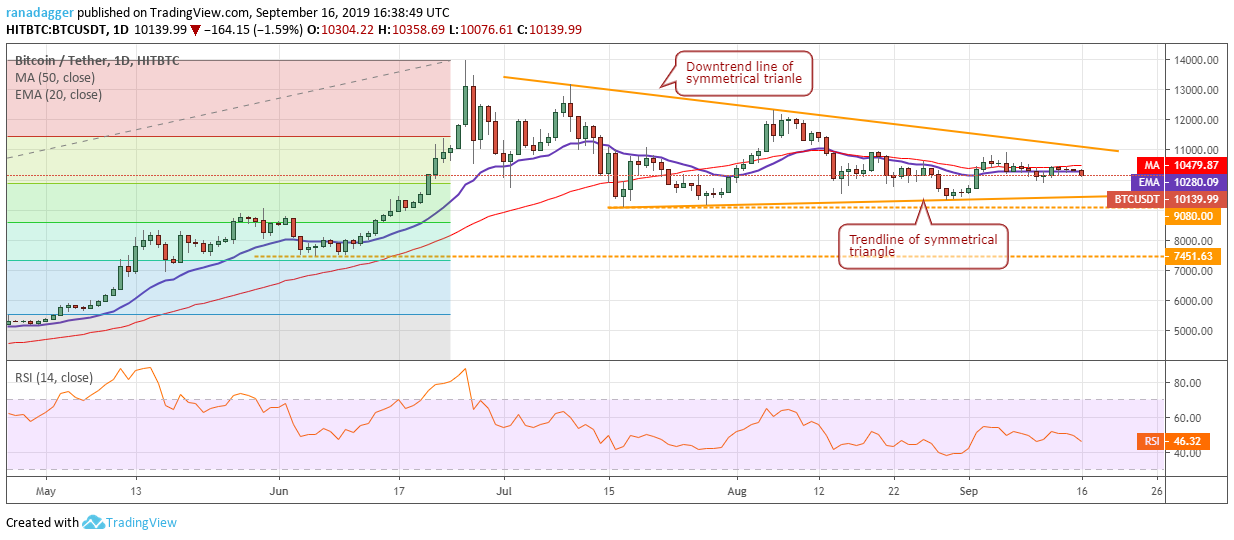
Bitcoin continues to trade inside the symmetrical triangle. After staying close to the moving averages for the past few days, Bitcoin is facing selling pressure. A break below the immediate support of $9,873.85 will sink the price to the trendline of the symmetrical triangle. If the cryptocurrency plummets below the triangle and $9,080, it can drop to the next support zone of $7,451.63–$7,337.78.
However, both moving averages have flattened out and the RSI is just below the midpoint, which points to a balance between buyers and sellers. If bulls defend the support at $9,080, the BTC/USD pair might remain range-bound for a few days.
If the bulls propel the price above the triangle, it will signal the resumption of the uptrend. The first target on the upside is a retest of the yearly high at $13,973.5. Hence, traders can wait and buy on a breakout of the triangle as proposed in an earlier analysis.
ETH/USD
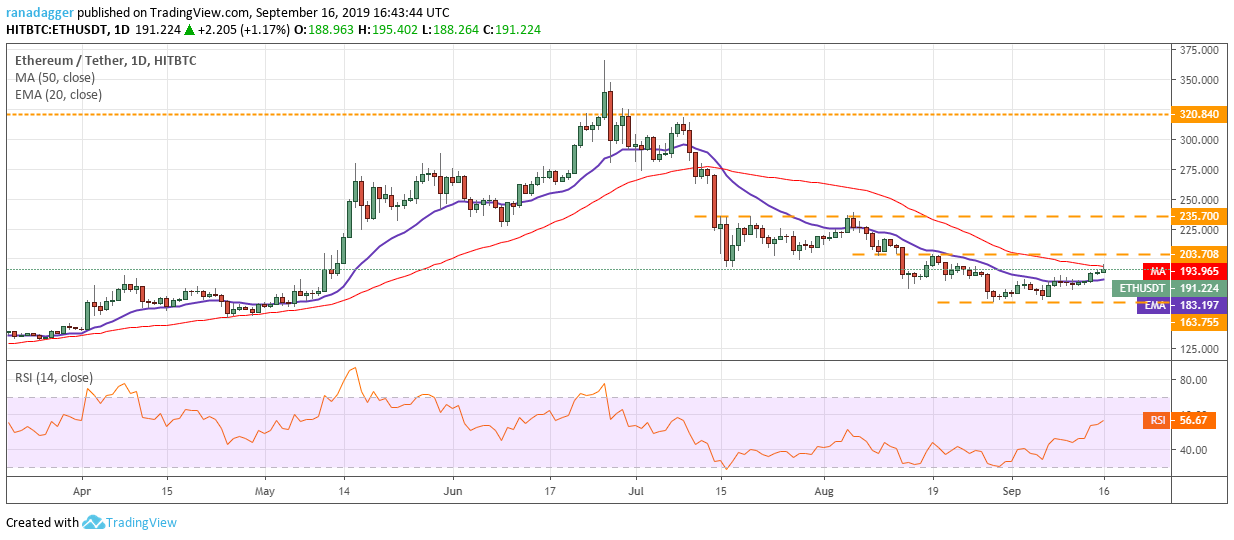
The pullback in Ether (ETH) is facing resistance at the 50-day SMA. Both moving averages have flattened out and the RSI has inched into the positive territory, which suggests consolidation for a few days.
However, we like the way the cryptocurrency has moved away from its recent lows, which shows that bulls are accumulating at lower levels. A breakout of $203.708 will indicate that the bulls have overpowered the bears and the ETH/USD pair is likely to start a new uptrend. The pair will gain momentum on a breakout above $235.70.
Conversely, if the price slips below the 20-day EMA, it can again retest the support at $163.755. A breakdown of this support will extend the decline to $150. We will wait for the price to sustain above $203.708 before suggesting a trade in it.
XRP/USD
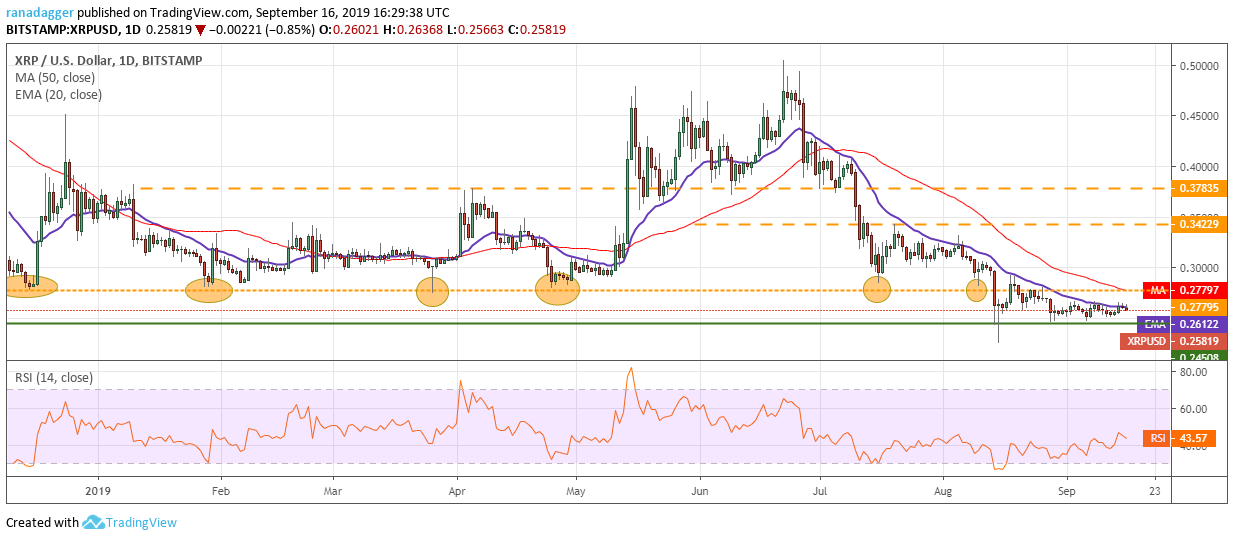
XRP has been trading between the 20-day EMA and $0.24508 for the past few days. The failure of the bulls to ascend the 20-day EMA shows a lack of demand even at these levels. In a down-move, when the price consolidates in a tight range near the strong support, the probability of a breakdown increases.
If bears sink the price below $0.24508, a retest of the yearly low at $0.225 will be in the cards. A drop to a new 52-week low will be a huge negative and can extend the fall to $0.19. Contrary to our assumption, if the XRP/USD pair rebounds sharply from the current levels or $0.24508 and rises above the moving averages, it will indicate strength. If the price sustains above $0.27795, a rally to $0.34229 is possible.
BCH/USD
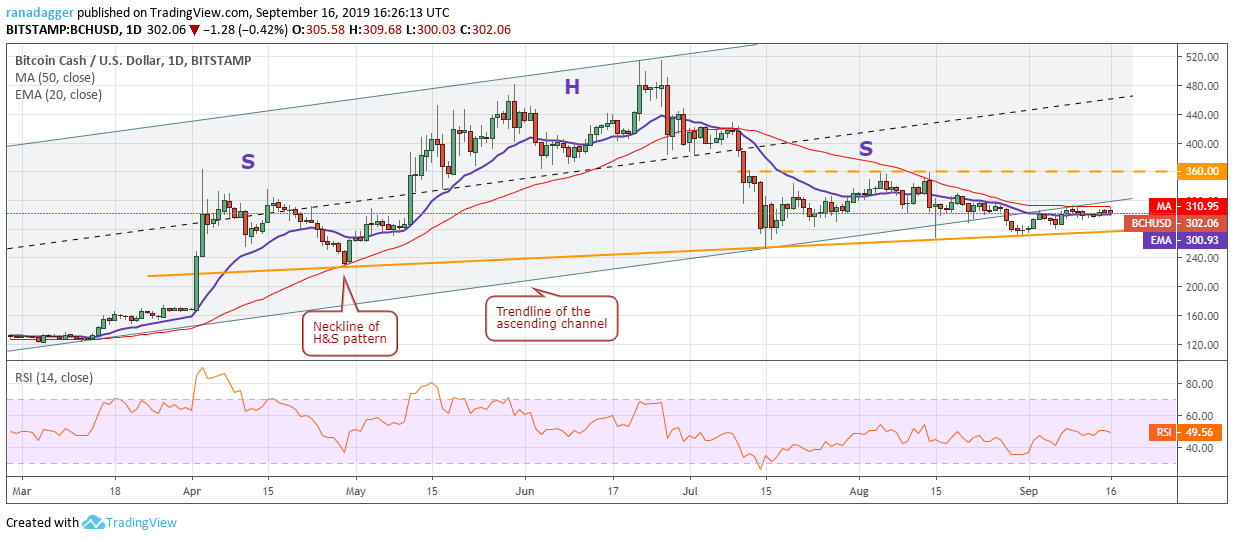
Bitcoin Cash (BCH) continues to trade between both moving averages that have flattened out and the RSI has also risen to the midpoint. This suggests a balance between buyers and sellers. If the cryptocurrency breaks out of the 50-day SMA, it can rally to $360.
A breakout of $360 will be a positive sign that will indicate a resumption of the up-move. However, if the BCH/USD pair turns down from $360, it might remain range-bound for a few days. The trend will turn hugely negative if the pair breaks down and sustains below the neckline of the head-and-shoulders pattern. The bearish setup can drag the price to $166.98 and below it to $105. We will wait for a breakout above $360 before recommending a trade in it.
LTC/USD
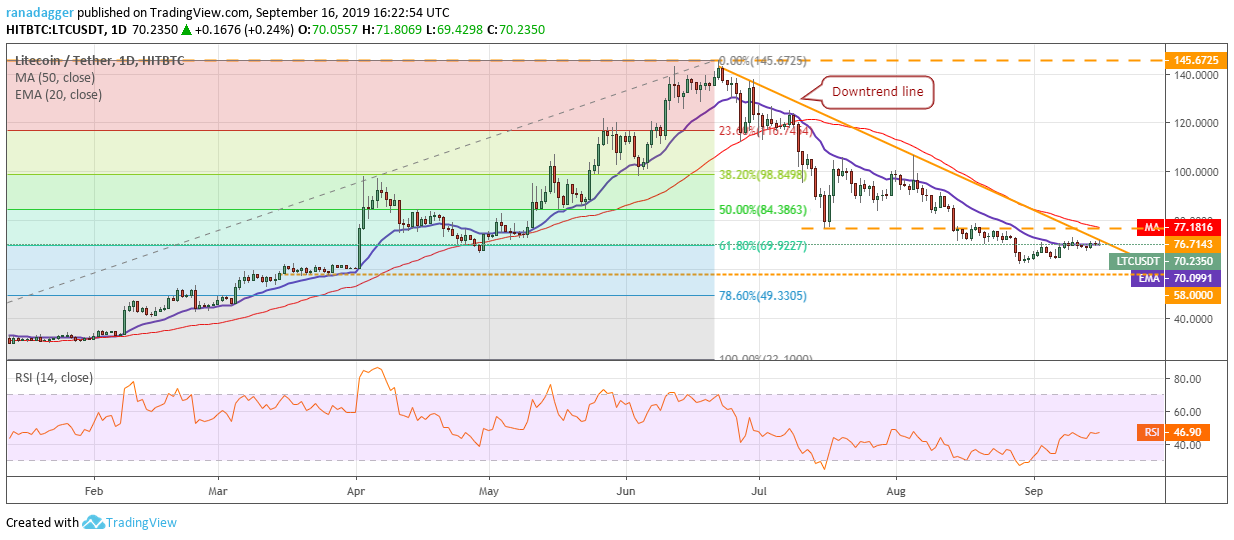
Litecoin (LTC) has been trading close to the 20-day EMA for the past few days. It is likely to breakout of the downtrend line, which shows that the selling pressure has abated. The 20-day EMA has flattened out and the RSI has risen to just below 50, which points to a consolidation in the short term.
The LTC/USD pair might remain range-bound between $58 and $76.7143 for the next few days. A breakout of this range is likely to signal the start of a new uptrend that can carry the price to $106.7774 and above it to $125. The downtrend will resume on a break below $62.0764–$58 support zone. We will suggest long positions after a breakout and close above $76.7143. Until then, we remain neutral on the cryptocurrency.
BNB/USD
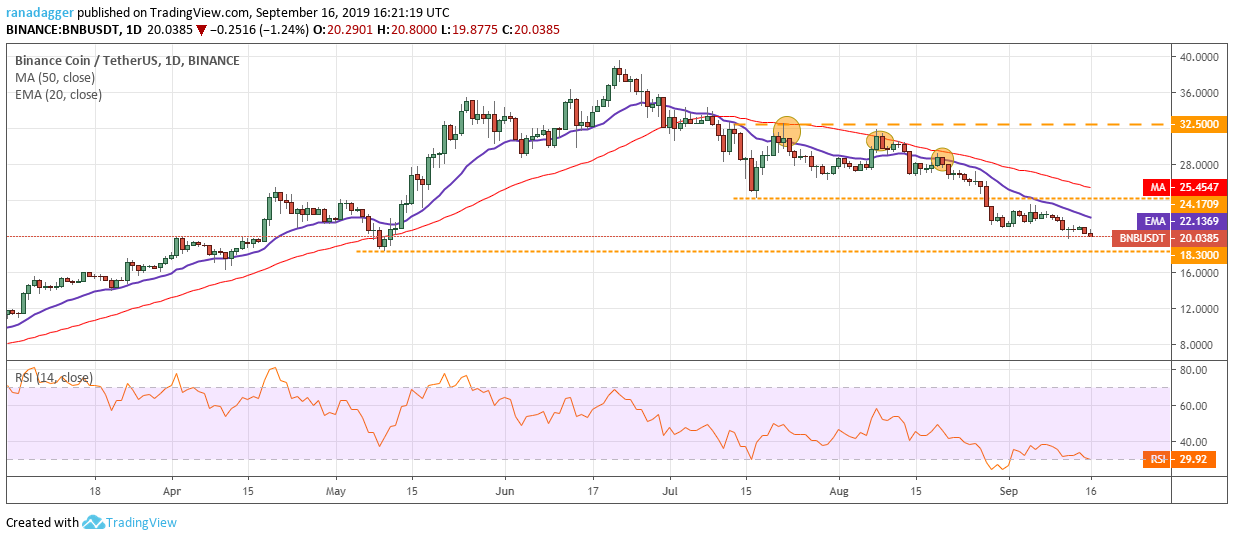
The failure of the bulls to push Binance Coin (BNB) back above the 20-day EMA is a bearish sign. With both moving averages sloping down and RSI close to the oversold zone, advantage is clearly with the bears. The next support on the downside is at $18.30. If this support breaks down, it will dent sentiment and can result in a fall to $16.
Nevertheless, if the BNB/USD pair holds $18.30, the bulls will attempt to propel the price above the moving averages. If successful, the pair will signal a change in trend. Above the moving averages, the first target is $32.50 and above it a rally to the lifetime highs is possible. We will wait for the price to either show a strong bounce at $18.30 or scale above the 50-day SMA before proposing a trade in it.
EOS/USD
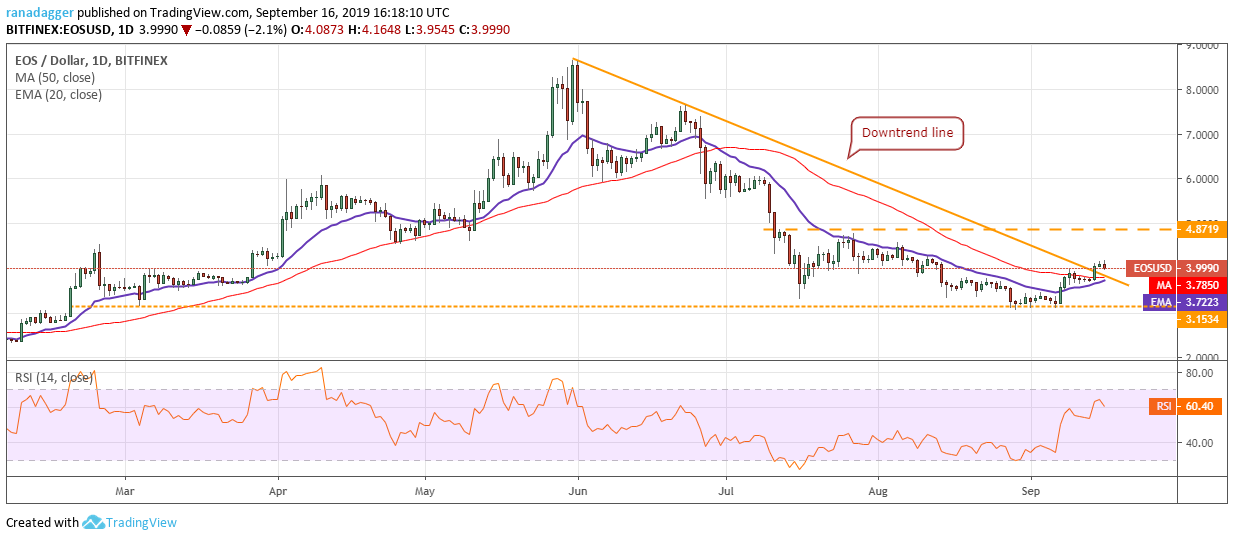
EOS broke out and closed (UTC time) above the downtrend line on Sept. 14, which triggered our buy recommended in an earlier analysis. The breakout of the downtrend line indicates the end of the downtrend. The moving averages are on the verge of a bullish crossover, which suggests that the bulls have the upper hand.
The first target on the upside is $4.8719 and if this level is crossed, the EOS/USD pair can pick up momentum and move up to $6. Contrary to our assumption, if the pair turns down from current levels and breaks below the moving averages, it can retest the support at $3.1534. If this support gives way, a fall to $2.20 is possible. Therefore, traders can retain the stop loss at $3.
BSV/USD
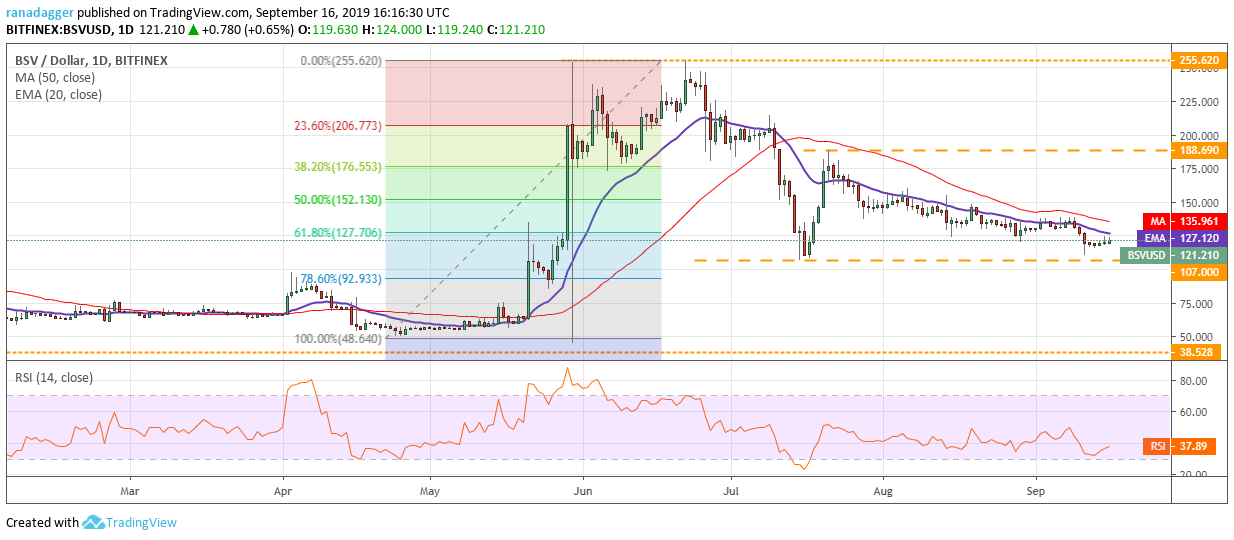
The bears could not sink Bitcoin SV (BSV) below $107 in the past five days. This shows buying by aggressive bulls near the support. The bulls will now try to push the price back above both moving averages, which are flattening out. Any recovery will face resistance at $150 and the cryptocurrency might consolidate between $107 and $150 for a few days. A breakout of $150 can carry the price to $188.69.
Our view will be negated if the BSV/USD pair turns down from the moving averages and plunges below $107. A breakdown of the critical support at $107 might trigger panic selling that can drag the price to $92.933 and below it to $48.64. We do not find any reliable buy setups at current levels, hence, we remain neutral on the pair.
XMR/USD
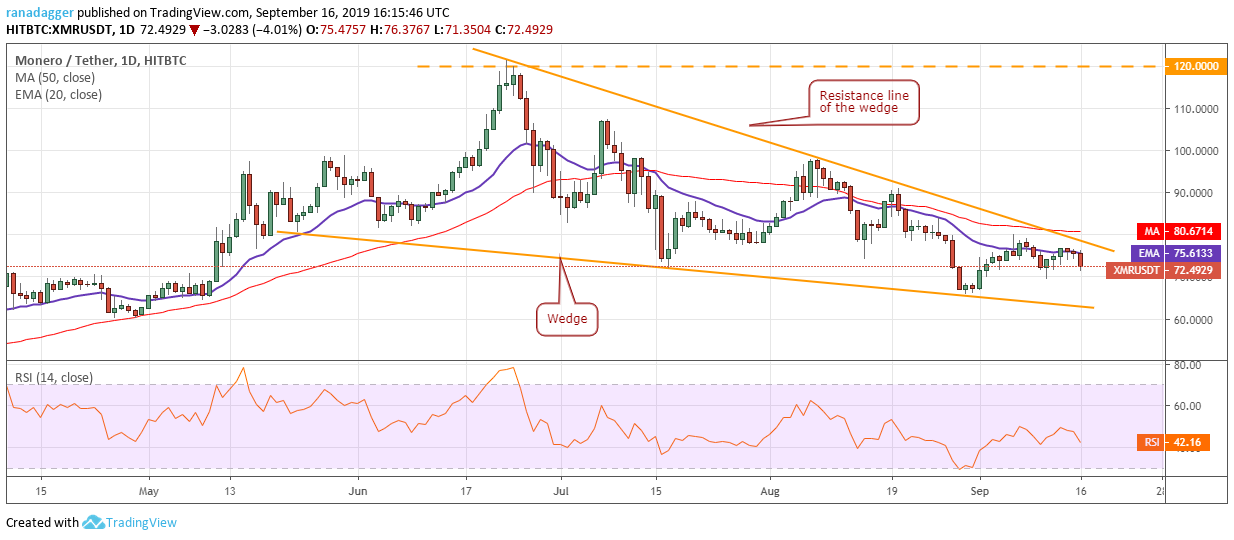
Monero (XMR) failed to break out and sustain above the 20-day EMA for the past three days, which is a negative sign. The bears will now attempt to sink the price below the immediate support of $69.4004. If successful, a drop to the bottom of the wedge is possible. A breakdown of the wedge will be a huge negative and can result in a fall to $50.
Our bearish view will be invalidated if the XRP/USD pair breaks out and closes (UTC time) above the wedge and the 50-day SMA. Above this, we anticipate the start of a new uptrend. The first target is $97 and above it $107. If this resistance is also scaled, a retest of $120 will be in the cards. Therefore, traders can initiate a long position on a close (UTC time) above the 50-day SMA and keep a stop loss of $65. We will soon trail the stops higher.
ADA/USD
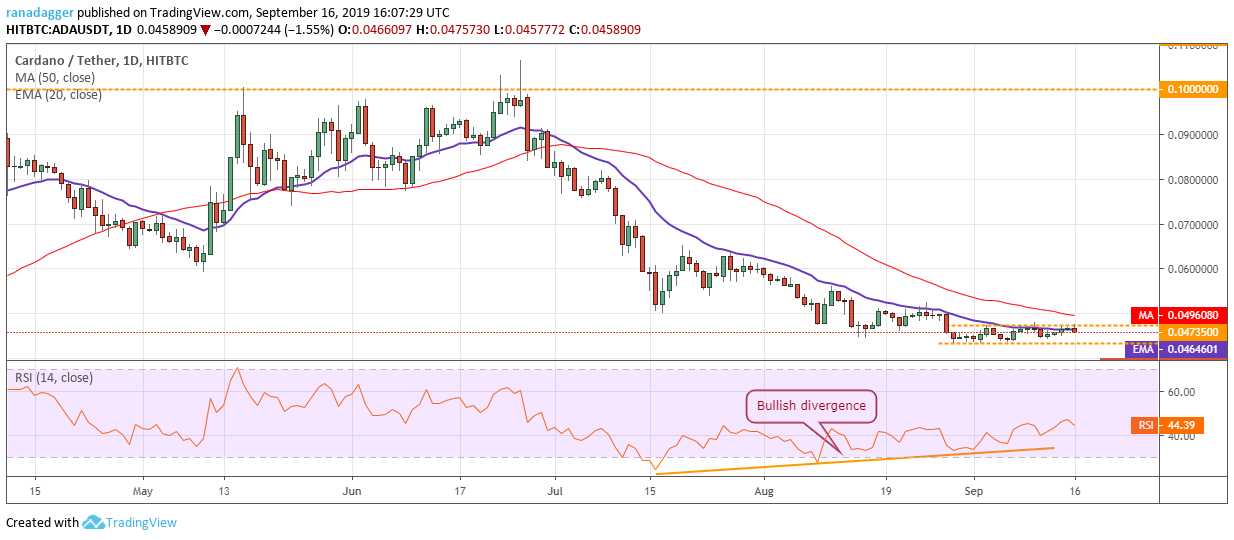
Cardano (ADA) has been trading close to the top of the $0.0433229–$0.04735 range for the past two days. This is a positive sign as it shows buying by aggressive bulls. Both moving averages have flattened out and the RSI has risen to just below 50, which shows that the trend has changed from down to range-bound.
The ADA/USD pair has not sustained above the 20-day EMA since June 27. Hence, a breakout and close (UTC time) above the moving averages will signal the start of a new uptrend. The first target will be a move to $0.056 and if that is crossed, the next level to watch is $0.063. The traders can buy on a breakout and close (UTC time) above the 50-day SMA and keep a stop loss of $0.043.
Our bullish view will be invalidated if the price fails to sustain above the moving averages and plummets below $0.0433229. In such a case, a drop to $0.035778 is probable.
The views and opinions expressed here are solely those of the author and do not necessarily reflect the views of CryptoX. Every investment and trading move involves risk. You should conduct your own research when making a decision.
Market data is provided by HitBTC exchange.


