Bitcoin bulls have set their sights on $50,000 and this renewed push is also boosting large and small-cap altcoin prices.
Bitcoin (BTC) is facing rejection near $50,000, indicating that bears are not ready to give up without a fight. Many analysts expect Bitcoin to soar in the last quarter of the year and stock-to-flow model creator PlanB says the “worst-case scenario” for Bitcoin in October is $63,000 and $98,000 by November.
PlanB is not alone in his bullish projection. Using Bitcoin’s relative strength index (RSI) indicator during the four-year cycle, Twitter commentator TechDev suggests that the second leg of the 2021 bull run may just be getting started. The trader expects Bitcoin’s cycle top to be around $200,000.
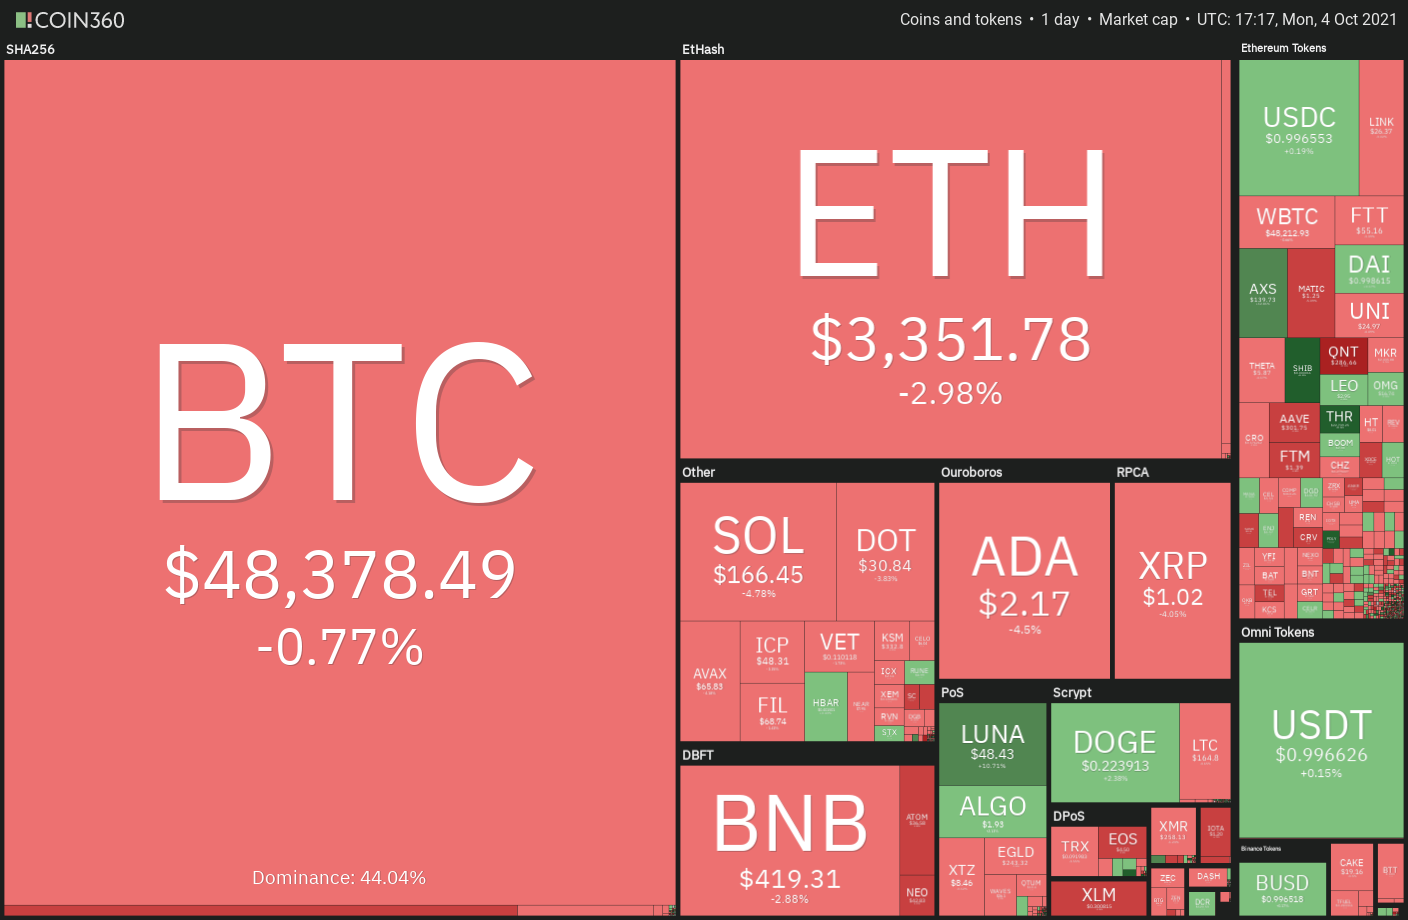
While historical projections may be pointing for a rally in the last quarter, the rise may not be linear. The US equity market’s volatility in October is 36% higher than the average for the remaining 11 months, according to CFRA chief investment strategist Sam Stovall. Due to Bitcoin’s high correlation with the S&P 500, traders may be in for a roller coaster ride in October.
Could Bitcoin follow its historical precedence and rally to the upside and will altcoins join in on the party? Let’s study the charts of the top-10 cryptocurrencies to find out.
BTC/USDT
The bulls pushed Bitcoin above the overhead resistance at $48,843.20 on Oct. 3 but the long wick on the day’s candlestick indicates that bears are defending the level aggressively. The price has been trading between the 50-day simple moving average ($46,667) and $48,843.20 for the past two days.
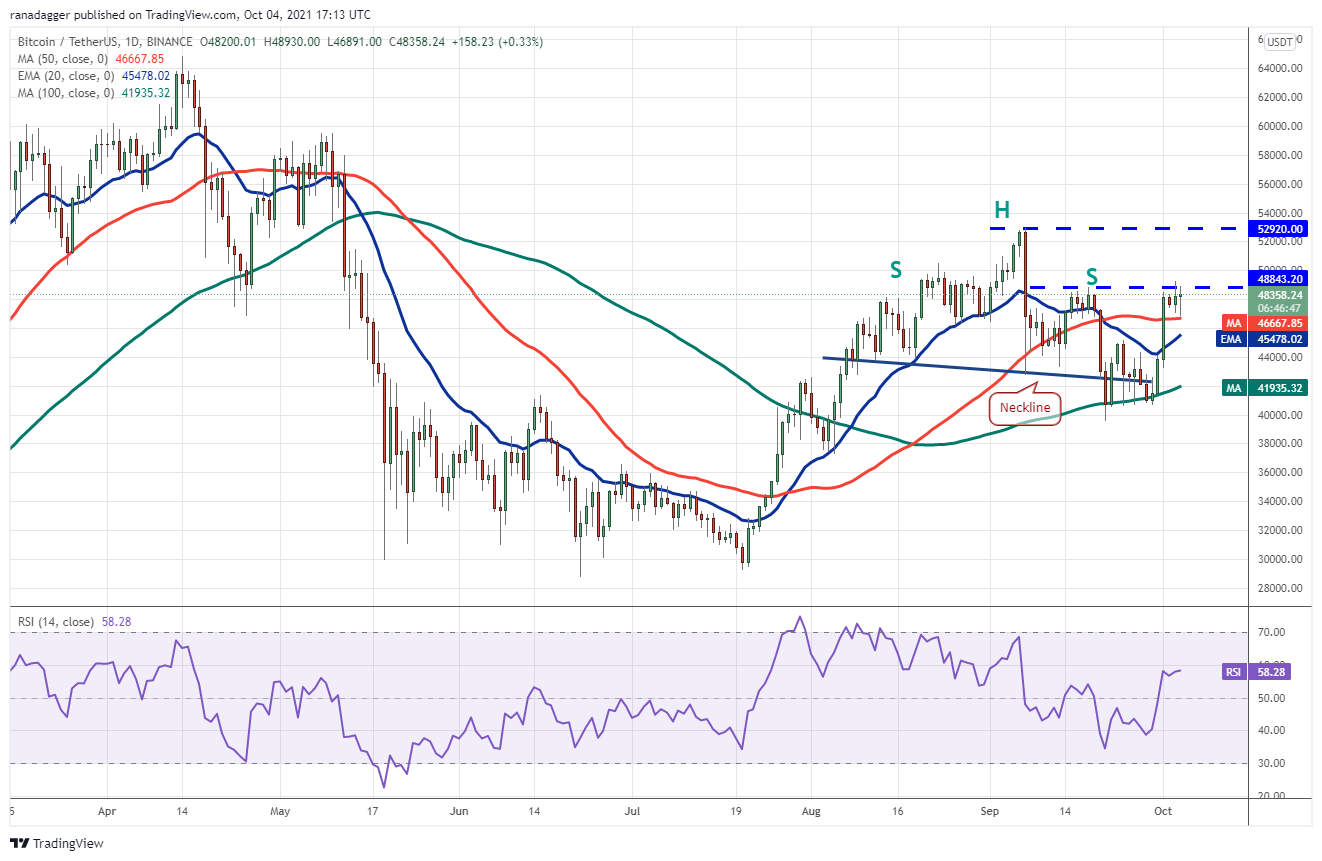
If bulls drive and sustain the price above the overhead resistance, the BTC/USDT pair could pick up momentum and rally to $50,000 and later to $52,920.
The 20-day exponential moving average ($45,478) has turned up and the RSI is in the positive territory, indicating the path of least resistance is to the upside.
Contrary to this assumption if bears pull the price below the 50-day SMA, the pair could drop to the 20-day EMA. A bounce off this support will be a positive sign and the bulls will make one more attempt to clear the overhead hurdle.
The advantage will tilt in favor of the bears if the price breaks and sustains below the 20-day EMA. The pair could then drop to the 100-day SMA ($41,935).
ETH/USDT
The bulls pushed Ether (ETH) above the downtrend line and the moving averages on Oct. 1 but the bears have not thrown in the towel yet. The sellers are attempting to stall the up-move near $3,500 and pull the price back below the 50-day SMA ($3,297).
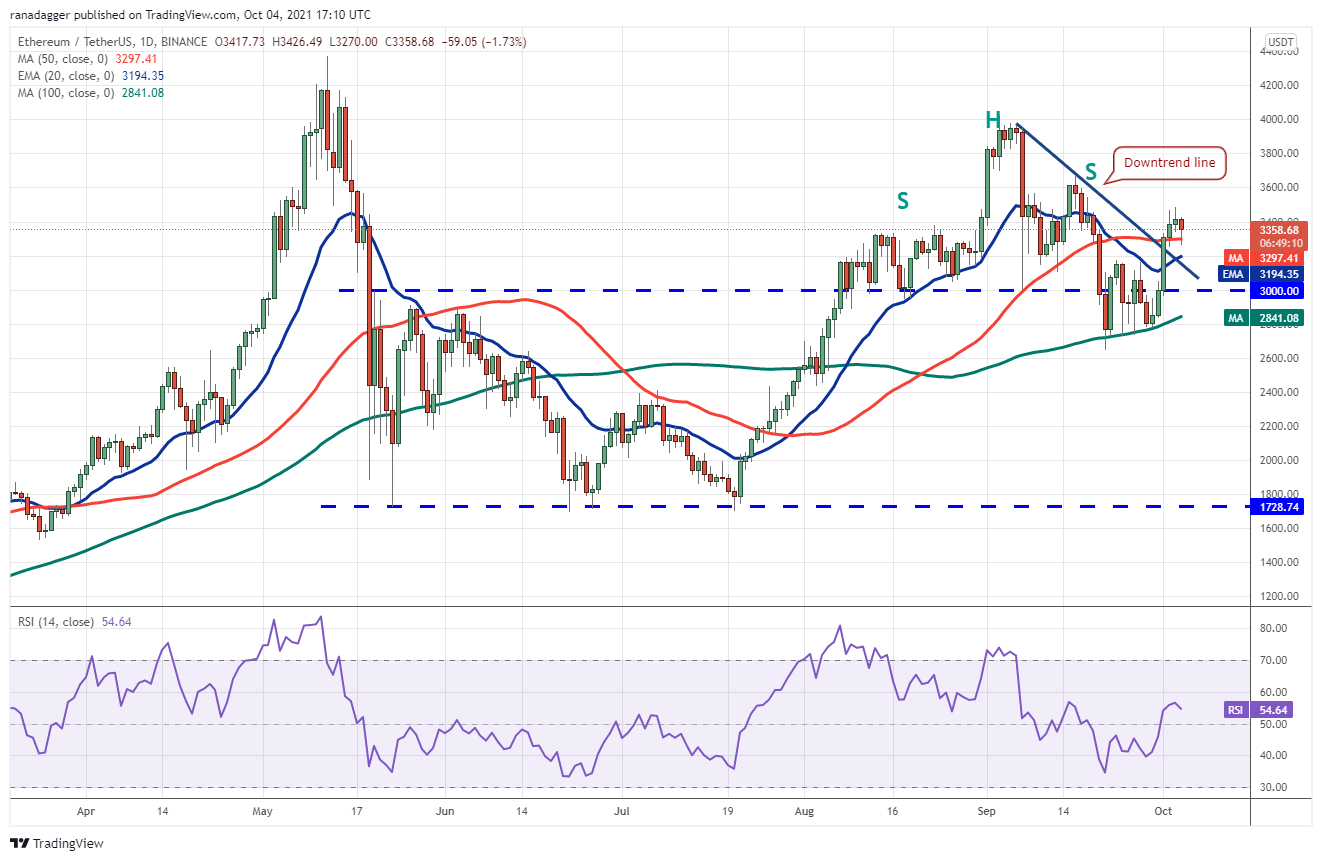
If they manage to do that, the ETH/USDT pair could drop to the 20-day EMA ($3,194). This is an important support for the bulls to defend because a break below it could attract further selling. The pair may then drop to the psychological level at $3,000 and later to the 100-day SMA ($2,841).
Alternatively, if the price rebounds off the moving averages, the bulls may make one more attempt to propel the price above $3,500. If the price sustains above this resistance, the pair could rise to $3,676.28 and then to $4,000.
BNB/USDT
Binance Coin (BNB) has been facing strong resistance at the overhead resistance at $433 but the positive sign is that bulls have not given up much ground. This indicates that buyers are holding on to their positions as they anticipate a move higher.
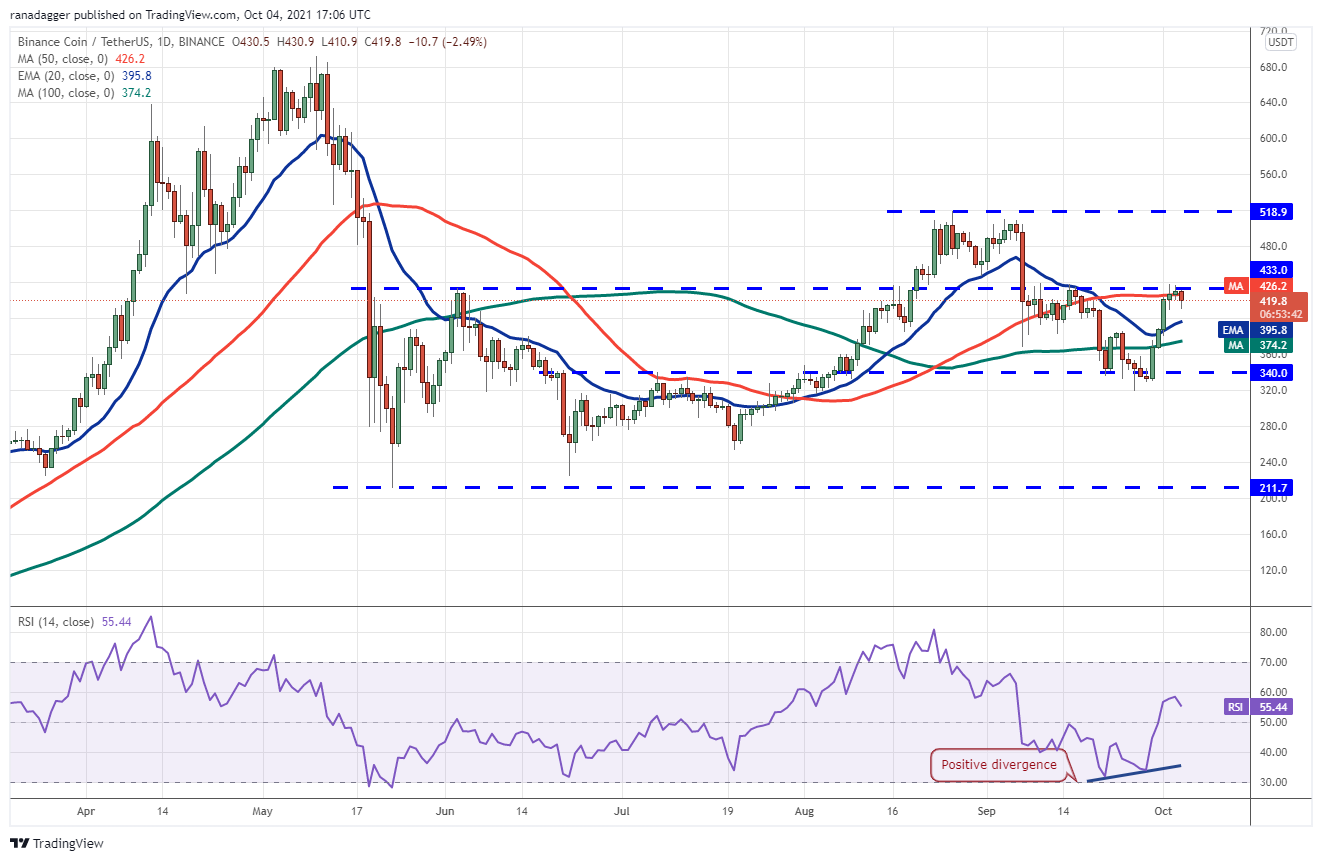
The 20-day EMA ($395) has turned up and the RSI is in the positive territory, indicating a slight advantage to the bulls. If buyers drive and sustain the price above $433, the BNB/USDT pair could pick up momentum and rally to $518.90.
Contrary to this assumption, if the price turns down from the current level, the pair may drop to the 20-day EMA. If the price rebounds off this level, the bulls will again try to push the pair above $433. A break and close below the 20-day EMA could keep the pair range-bound for a few days.
ADA/USDT
The bulls pushed Cardano (ADA) above the 20-day EMA ($2.25) for the past two consecutive days but they could not sustain the higher levels. This suggests that the sentiment remains negative and traders are defending the 20-day EMA.
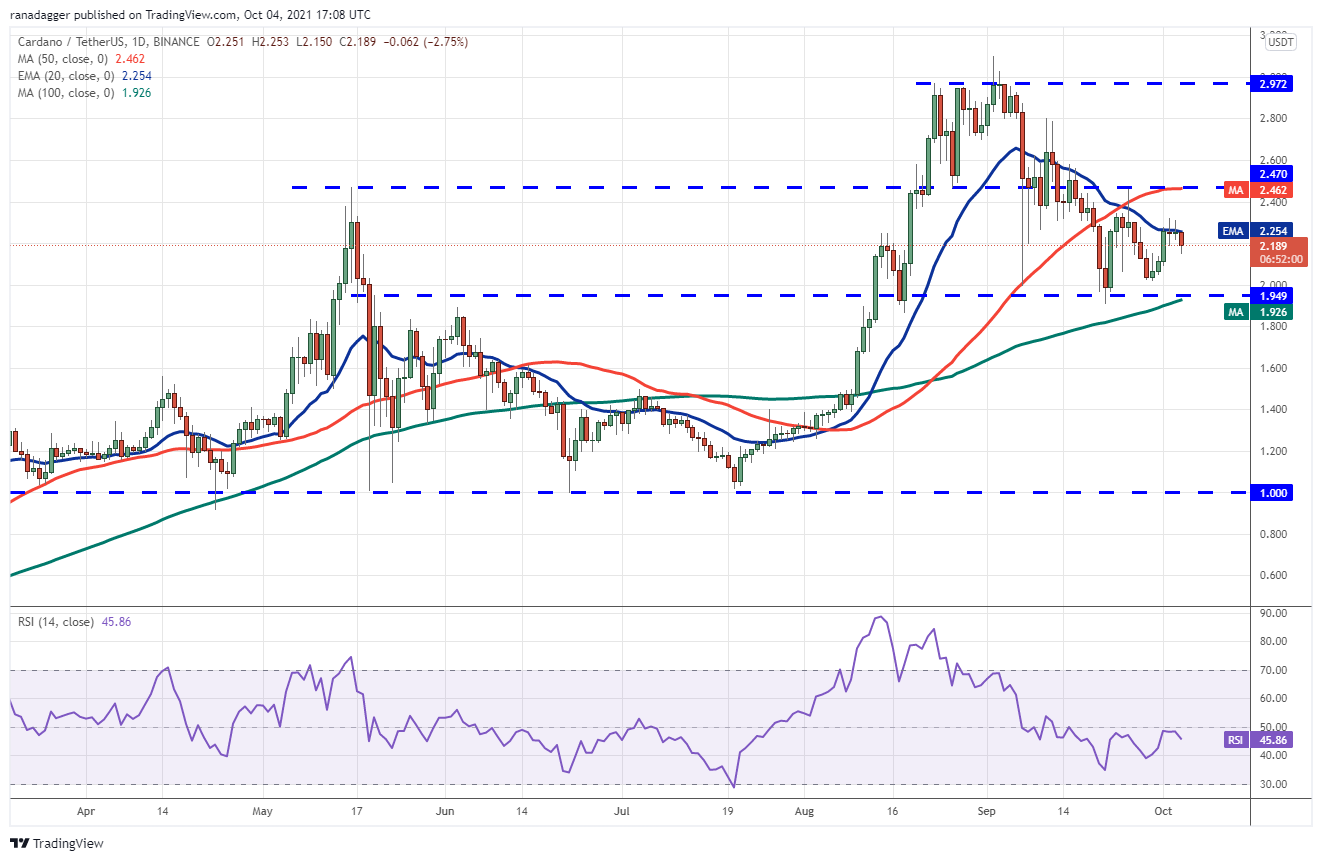
The price has turned down from the 20-day EMA today and the bears will now try to sink the ADA/USDT pair to the critical support at $1.94. If this level gives way, the pair could witness aggressive selling and plummet to $1.60.
This negative view will invalidate if the price turns up from the current level or rebounds off the $1.94 support and rises above the 20-day EMA. The pair could then rally to the 50-day SMA ($2.46) where bears may again mount a stiff resistance. A break above this level could clear the path for an up-move to $2.97.
SOL/USDT
Solana’s (SOL) recovery reached the 61.8% Fibonacci retracement level at $177.80 on Oct. 3. This level is acting as a stiff resistance and the bears are trying to pull the price to the 20-day EMA ($150).
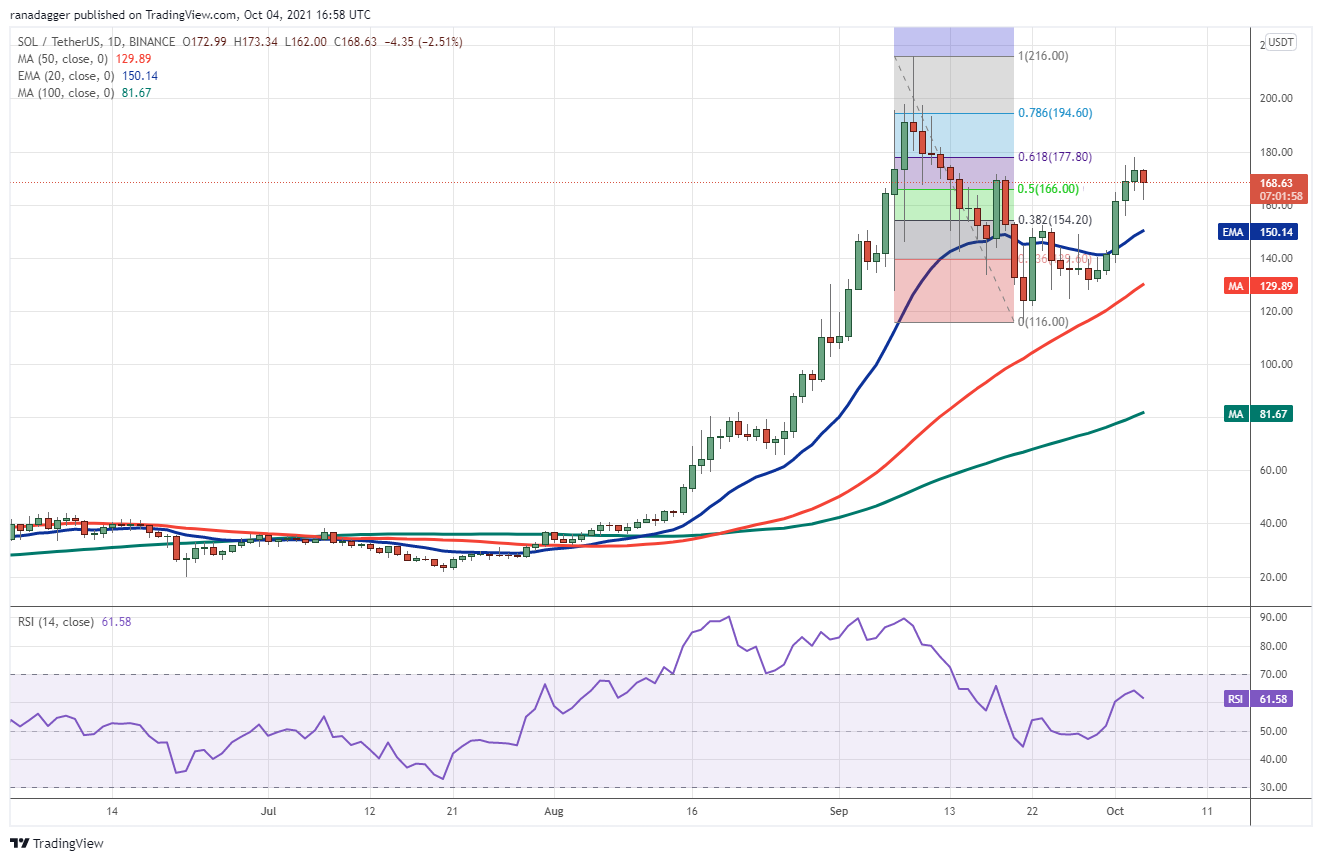
If the price rebounds off the current levels or the 20-day EMA, it will suggest that bulls are buying on dips. That will increase the possibility of a break above $177.80. If that happens, the SOL/USDT pair could rise to $200 and then retest the all-time high at $216.
Alternatively, if the price turns down from the current level and breaks below the 20-day EMA, it will suggest that traders are closing their positions. The pair may then drop to the 50-day SMA ($129) and later to $116.
XRP/USDT
XRP rose above the 20-day EMA ($1.01) on Oct. 1 and bulls tried to push the price above the $1.07 overhead resistance on Oct. 3. However, the long wick on the day’s candlestick suggests that bears are defending the 50-day SMA ($1.10) forcefully.
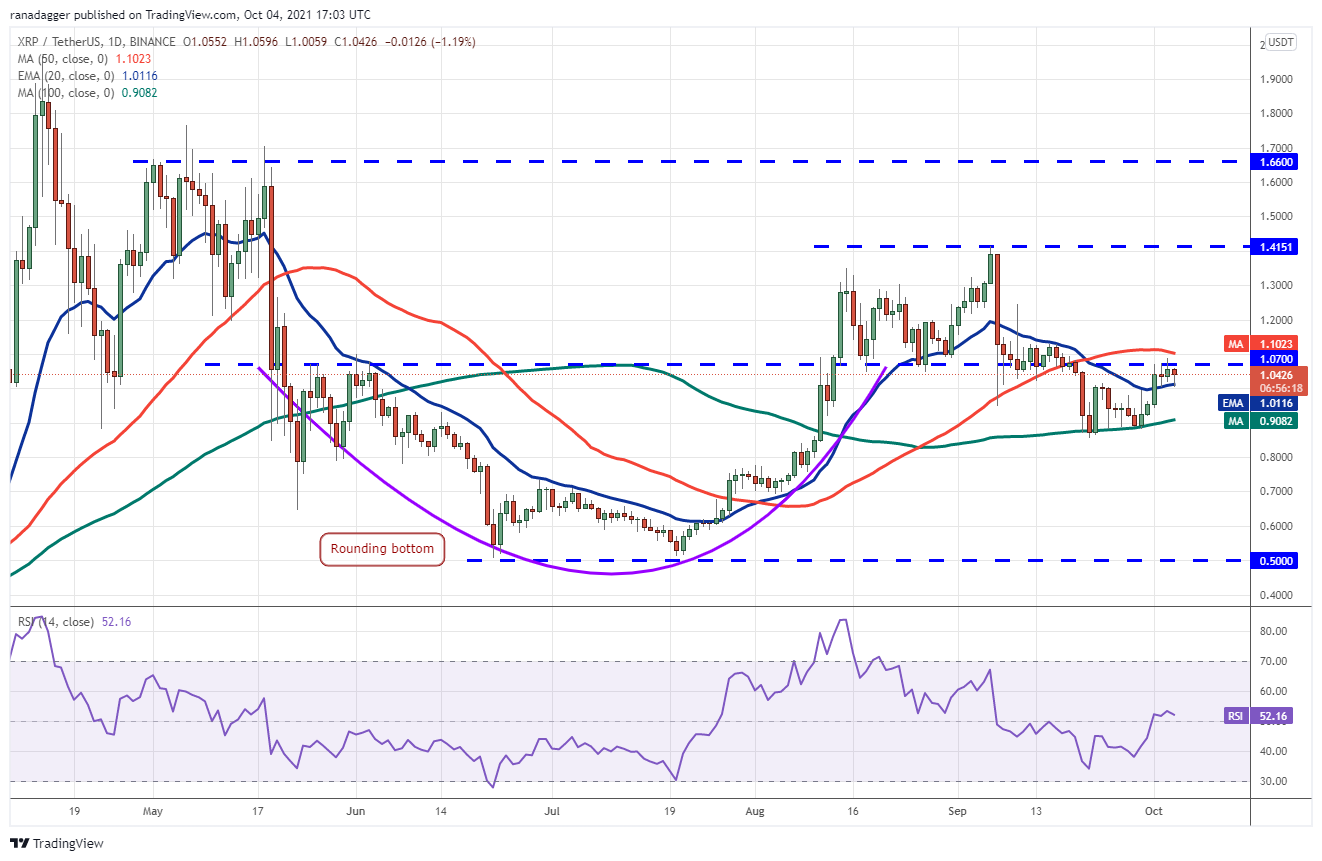
The price is currently stuck in the tight range between the 20-day EMA and the 50-day SMA. Both moving averages are flattish and the RSI is near the midpoint, indicating a balance between supply and demand.
This balance will tilt in favor of buyers if the price breaks and sustains above the 50-day SMA. The XRP/USDT pair could then start its journey toward the next resistance at $1.41.
On the contrary, if the price breaks and sustains below the 20-day EMA, the pair could drop to the 100-day SMA ($0.90). A break below this support could signal that bears are back in command.
DOT/USDT
Polkadot (DOT) broke above the moving averages and the downtrend line on Oct. 1, which was the first indication that bears may be losing their grip. The bulls tried to push the price above the right shoulder of the head and shoulders pattern on Oct. 2 but the long wick on the day’s candlestick indicates selling at higher levels.
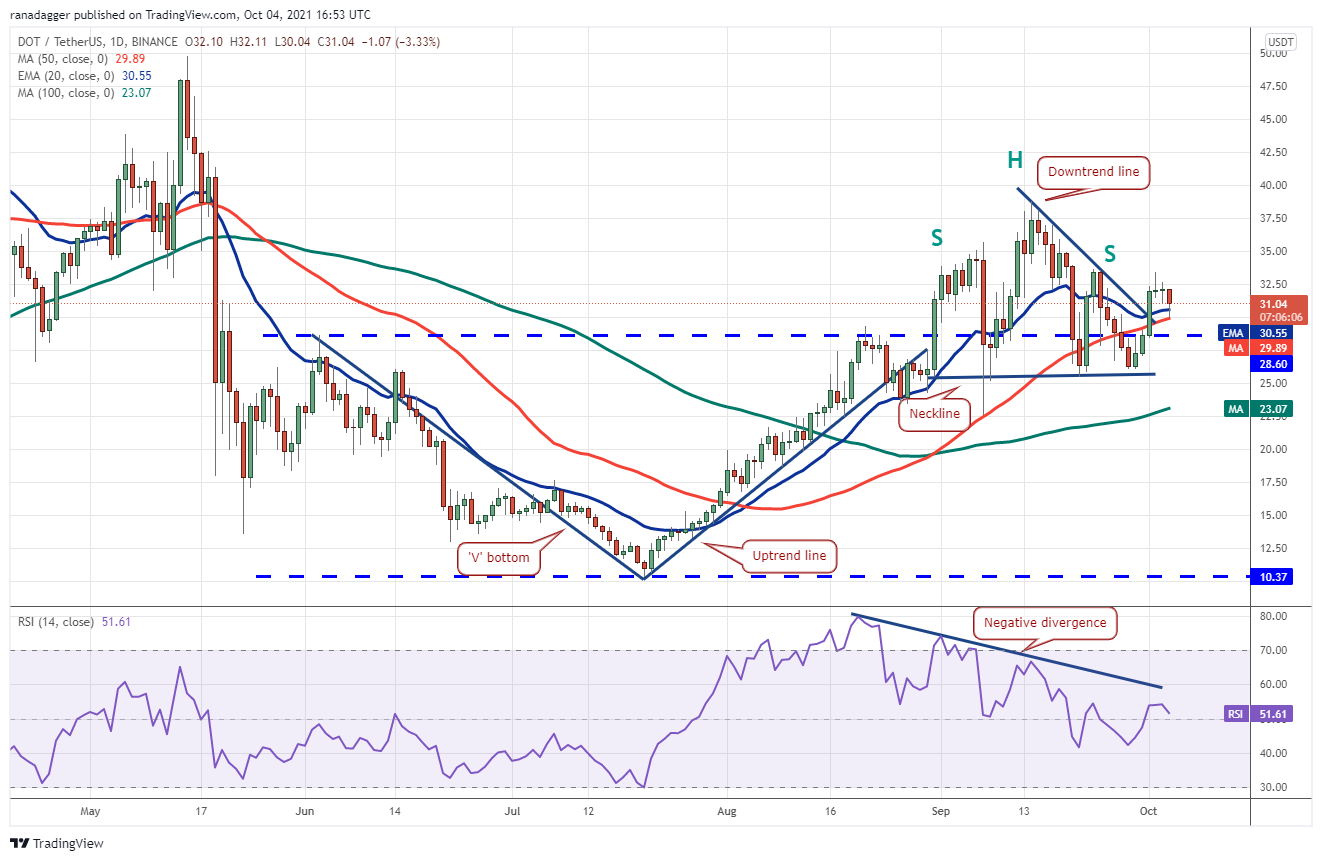
The DOT/USDT pair formed a Doji candlestick pattern on Oct. 3, indicating indecision among the bulls and the bears. This uncertainty has resolved to the downside today and the bears are trying to sink the price below the moving averages.
If they succeed, it will suggest that sentiment remains negative and traders are selling on rallies. The pair could then challenge the neckline of the H&S pattern.
Conversely, if the price rebounds off the moving averages, the bulls will once again try to propel the price above the right shoulder and retest the critical resistance at $38.77.
Related: Is Axie Infinity overheating? AXS price hits record high following 100% QTD rally
DOGE/USDT
Dogecoin (DOGE) recovered to the 20-day EMA ($0.22) on Oct. 1 but the bulls have not been able to sustain the price above this resistance in the past few days. This shows that sentiment is negative and bears are selling on rallies.
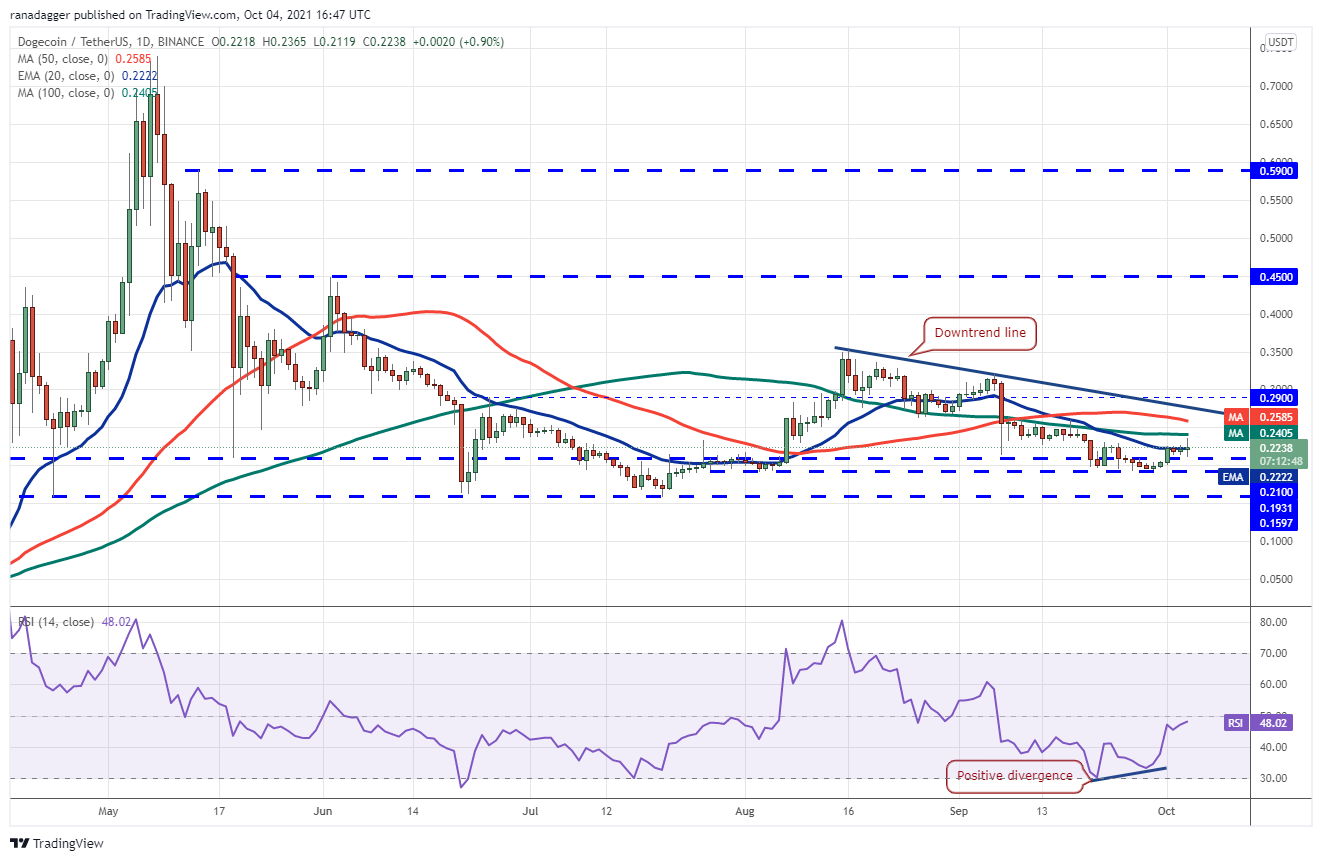
The long-legged Doji candlestick pattern today shows that bulls are buying near the $0.21 support while bears are selling near the 100-day SMA ($0.24). If this uncertainty resolves to the downside, the DOGE/USDT pair could drop to $0.19 and then to $0.15.
On the contrary, if bulls drive and sustain the price above the 100-day SMA, the pair could rally to the downtrend line, which could again act as a stiff resistance. A break and close above this level will be the first indication that the correction may be ending.
LUNA/USDT
The long wick on the Oct. 3 candlestick suggests that bears attempted to defend the $45.01 level but they could not sustain the lower levels. Aggressive buying by the bulls today has pushed Terra protocol’s LUNA token to a new all-time high.
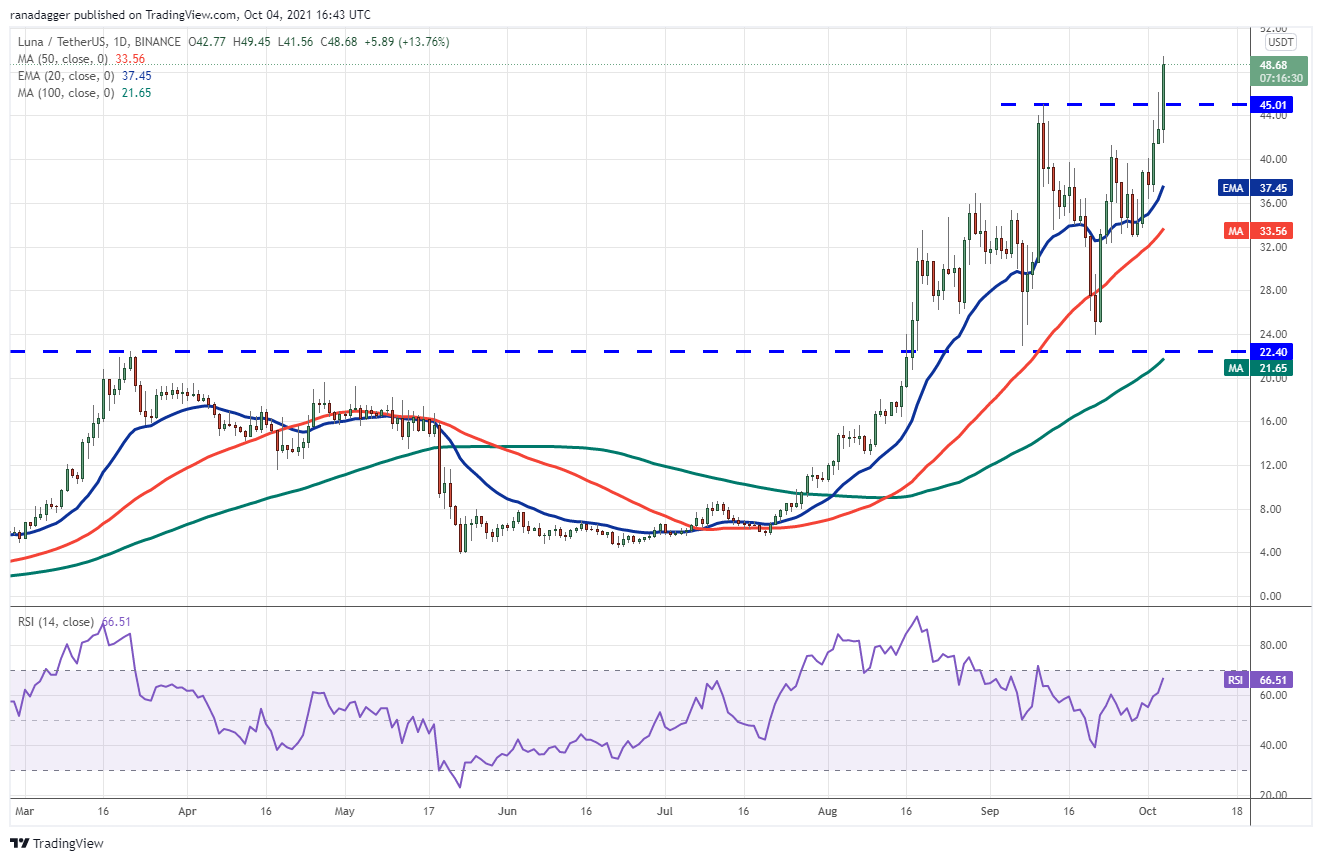
If bulls sustain the price above $45.01, it will suggest the start of a new uptrend. The rising moving averages and the RSI in the positive zone indicate that bulls are in control. The LUNA/USDT pair could first rise to $50 and if this psychological hurdle is cleared, the next stop could be $65.
Conversely, if the price fails to sustain above $45.01, the bears will try to pull the price down to the 20-day EMA ($37.45). A strong bounce off this support will suggest that the positive sentiment is intact. The bears will have to sink and sustain the price below the 50-day SMA ($33.56) to gain the upper hand.
UNI/USDT
Uniswap (UNI) rose above the 50-day SMA ($25.46) on Oct. 2 but the long wick on the day’s candlestick suggests that bears sold at higher levels. The altcoin formed an inside-day candlestick pattern on Oct. 3, indicating indecision among bulls and bears.
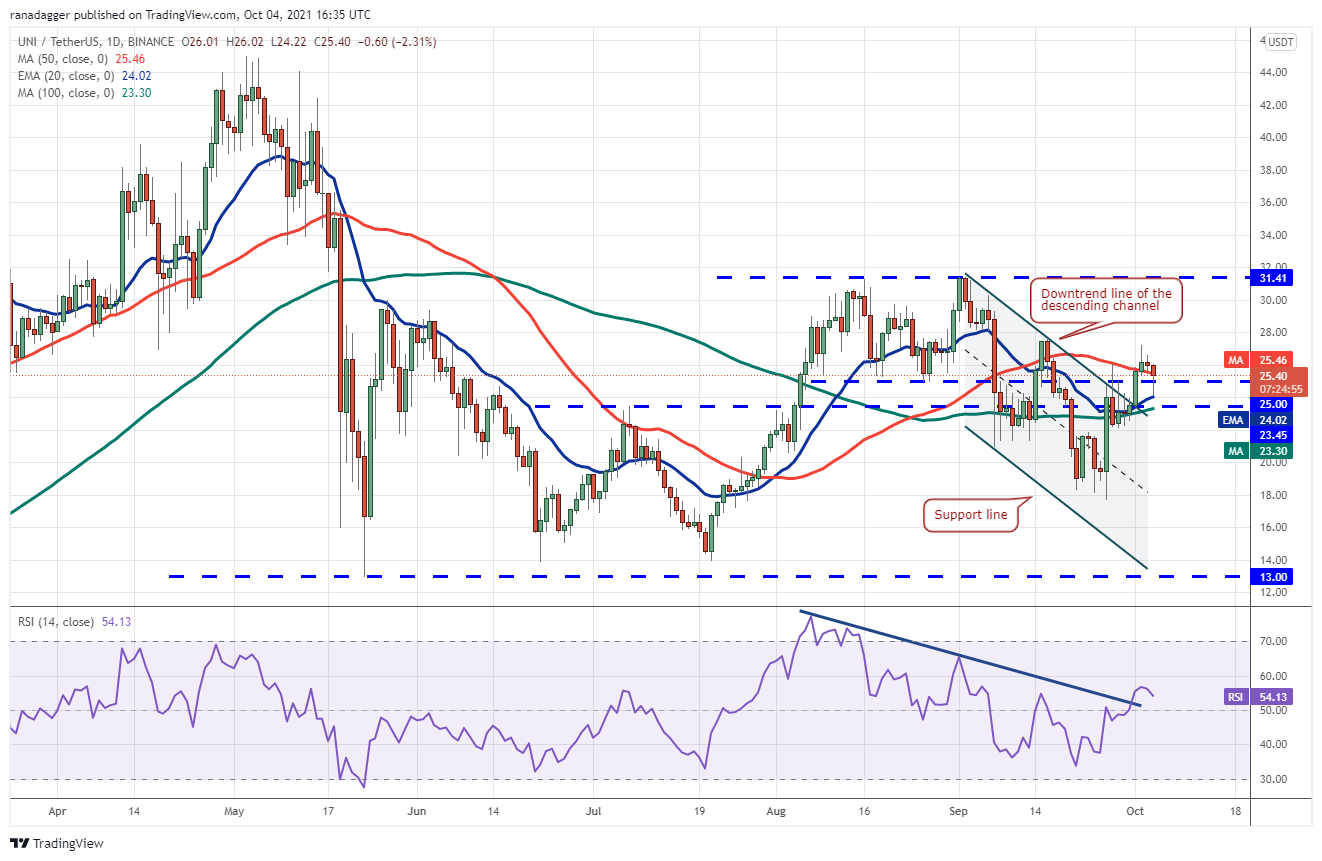
The uncertainty resolved to the downside and bears pulled the price to the 20-day EMA ($24.02) today but a positive sign is that bulls bought the dip aggressively, as seen from the long tail on the day’s candlestick.
If the price sustains above $25, the bulls will again try to push the UNI/USDT pair above $27.62. Above this level, the pair could retest the critical resistance at $31.41.
On the other hand, if the price breaks below the moving averages, the pair could drop to $22. This is an important support for the bulls to defend because if it cracks, the decline could extend to $18.
The views and opinions expressed here are solely those of the author and do not necessarily reflect the views of Cryptox. Every investment and trading move involves risk. You should conduct your own research when making a decision.
Market data is provided by HitBTC exchange.


