Polkadot recovered on its chart, over the last 24 hours the coin surged over 4%. Over the past week, the altcoin did not register much price movement.
The altcoin painted a bullish picture today with technical outlook pointing towards a change in price action. The coin regained its lost value quite a bit considering DOT flashed signs of revival.
Polkadot has been breaking past resistance lines one after the other and at the moment the coin could aim at its overhead price ceiling.
Price started to pick up momentum ever since it moved past the $9 price level. The aforementioned price level is now acting as a support level. Buying pressure returned in the market which indicated that DOT was regaining its bullish price action.
Polkadot Price Analysis: One Day Chart
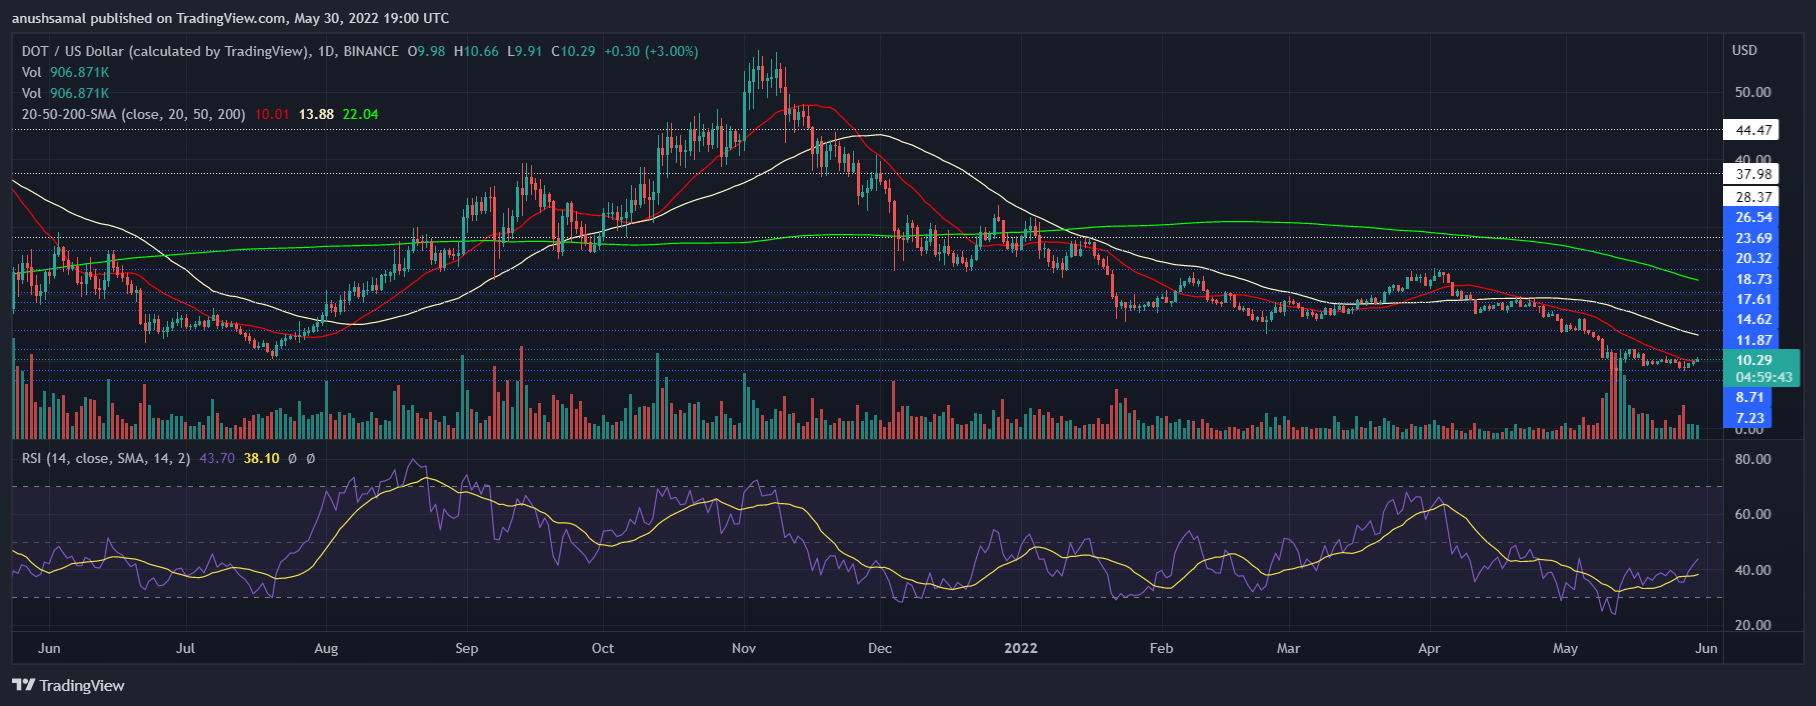
DOT was priced at $10.27 at the time of writing. The nearest price floor stood at $9, the other support lines stood at $8.71 and $7.20.
Overhead resistance for the coin stood at $11.87, the coin had attempted to trade above the $11 so if the bulls push a little harder then the coin can retest the aforementioned level.
If the coin continues to trade above the $11 then the altcoin could manage to trade near the $14.62. The volume of the coin was seen in the green which indicated that the coin was turn bullish.
This also signified that the buying pressure was increasing on the chart.
Technical Analysis

DOT started to display changes in price and the technical pointed towards bullishness. The coin after it surged, tried to rise above the 20-SMA line.
At the time of the writing, the coin stood above the 20-SMA line. This indicated that buyers were in charge on the price momentum in the market.
The Relative Strength Index noted an uptick on the one day chart. This was in accordance with the above indicator which displayed a rise in buying strength.
Related Reading | Negative Sentiment Deepens In Crypto, Why Recovery May Not Last

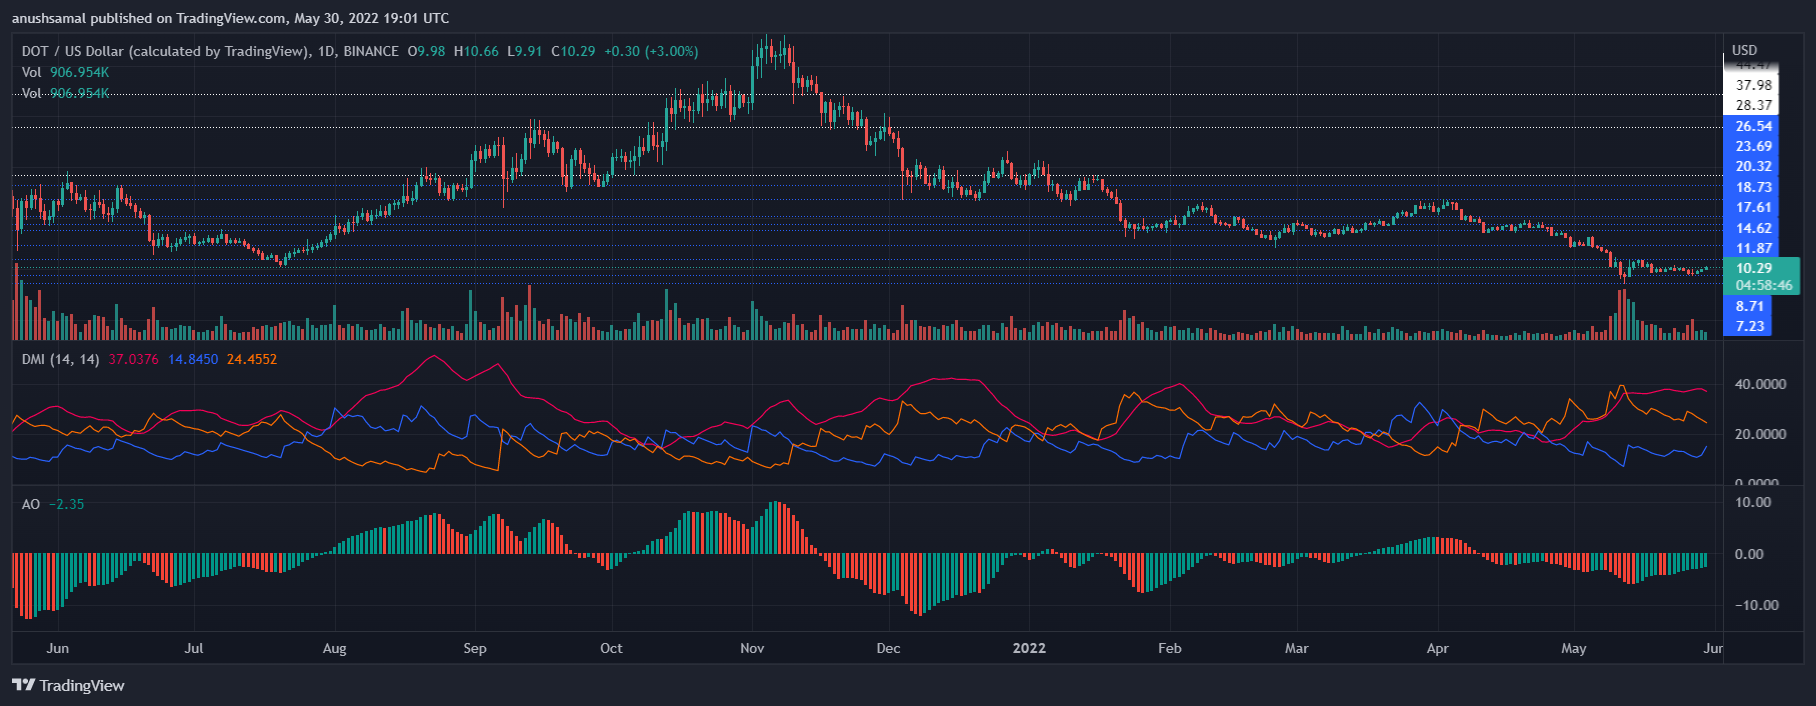
Polkadot registered a buy signal as soon as the buyers came back in the market. Awesome Oscillator depicted green signal bars. The indicator depicts the price momentum of the market.
The green signal bars also indicate a buying signal. If the buyers continue to act on it, the price could move above the overhead resistance.
The Directional Movement Index was turning positive as the +DI line was slowly moving upwards. The
Average Directional Index (Red) was above the 40-mark, this depicted the strength in the price momentum at the time of writing. For Polkadot to maintain its current price action, broader market strength would be required.
Related Reading | Polkadot (DOT) Trades Beneath $11; How Soon Will It Target $14?


