An analyst has explained how the growth in “paper BTC” could be counteracting a bullish Bitcoin supply shock from taking effect.
Liquid Bitcoin Supply Has Dropped, But Paper BTC Is Still At Significant Levels
In a new post on X, analyst Willy Woo shared insight into how the paper BTC compares against the real BTC being traded. According to the analyst, “paper BTC” refers to the combined futures open interest value.
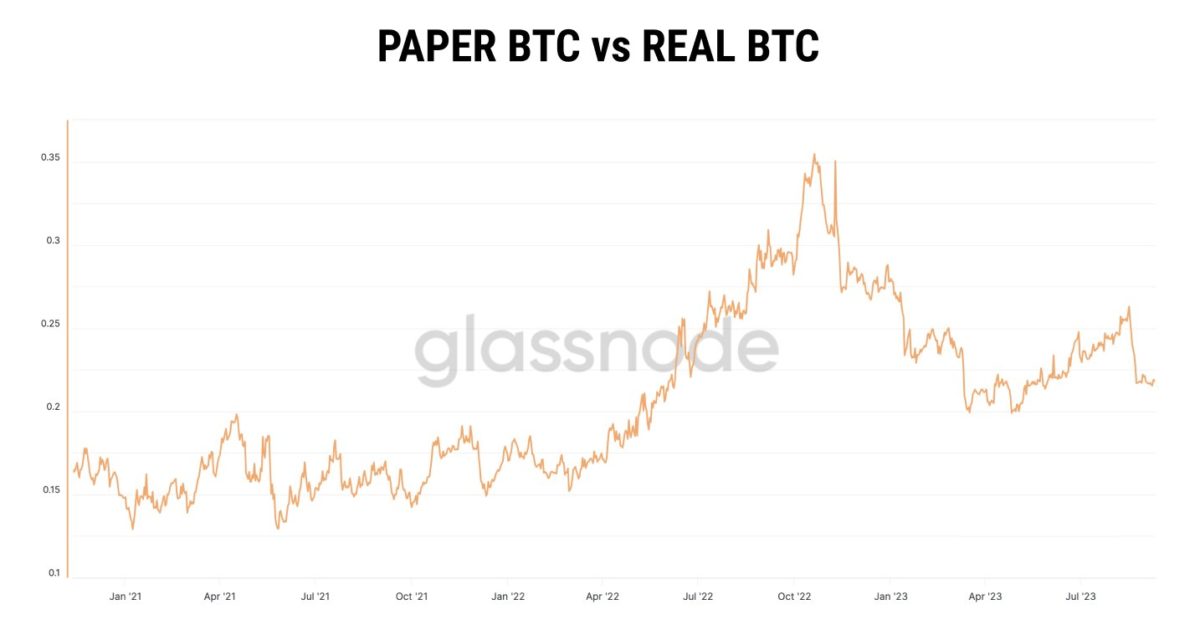
Here is a chart that shows the trend in the ratio between the two types of Bitcoin over the past couple of years:
The data for the paper vs real BTC ratio since January 2021 | Source: @woonomic on X
The graph shows that the ratio’s value has fluctuated between 0.2 and 0.3 in recent months, suggesting that the paper Bitcoin has been 20 to 30% more than the real coins during this period.
The real supply of the cryptocurrency may be divided into three categories: illiquid, liquid, and highly liquid. The on-chain analytics firm Glassnode puts coins into these divisions based on the behavior of the investors holding them.
To be more precise, the ratio between the cumulative outflows and inflows of the investor since they entered the market is used to define their liquidity. This ratio’s value approaches zero for the illiquid supply, as holders of this cohort rarely move coins out of their addresses.
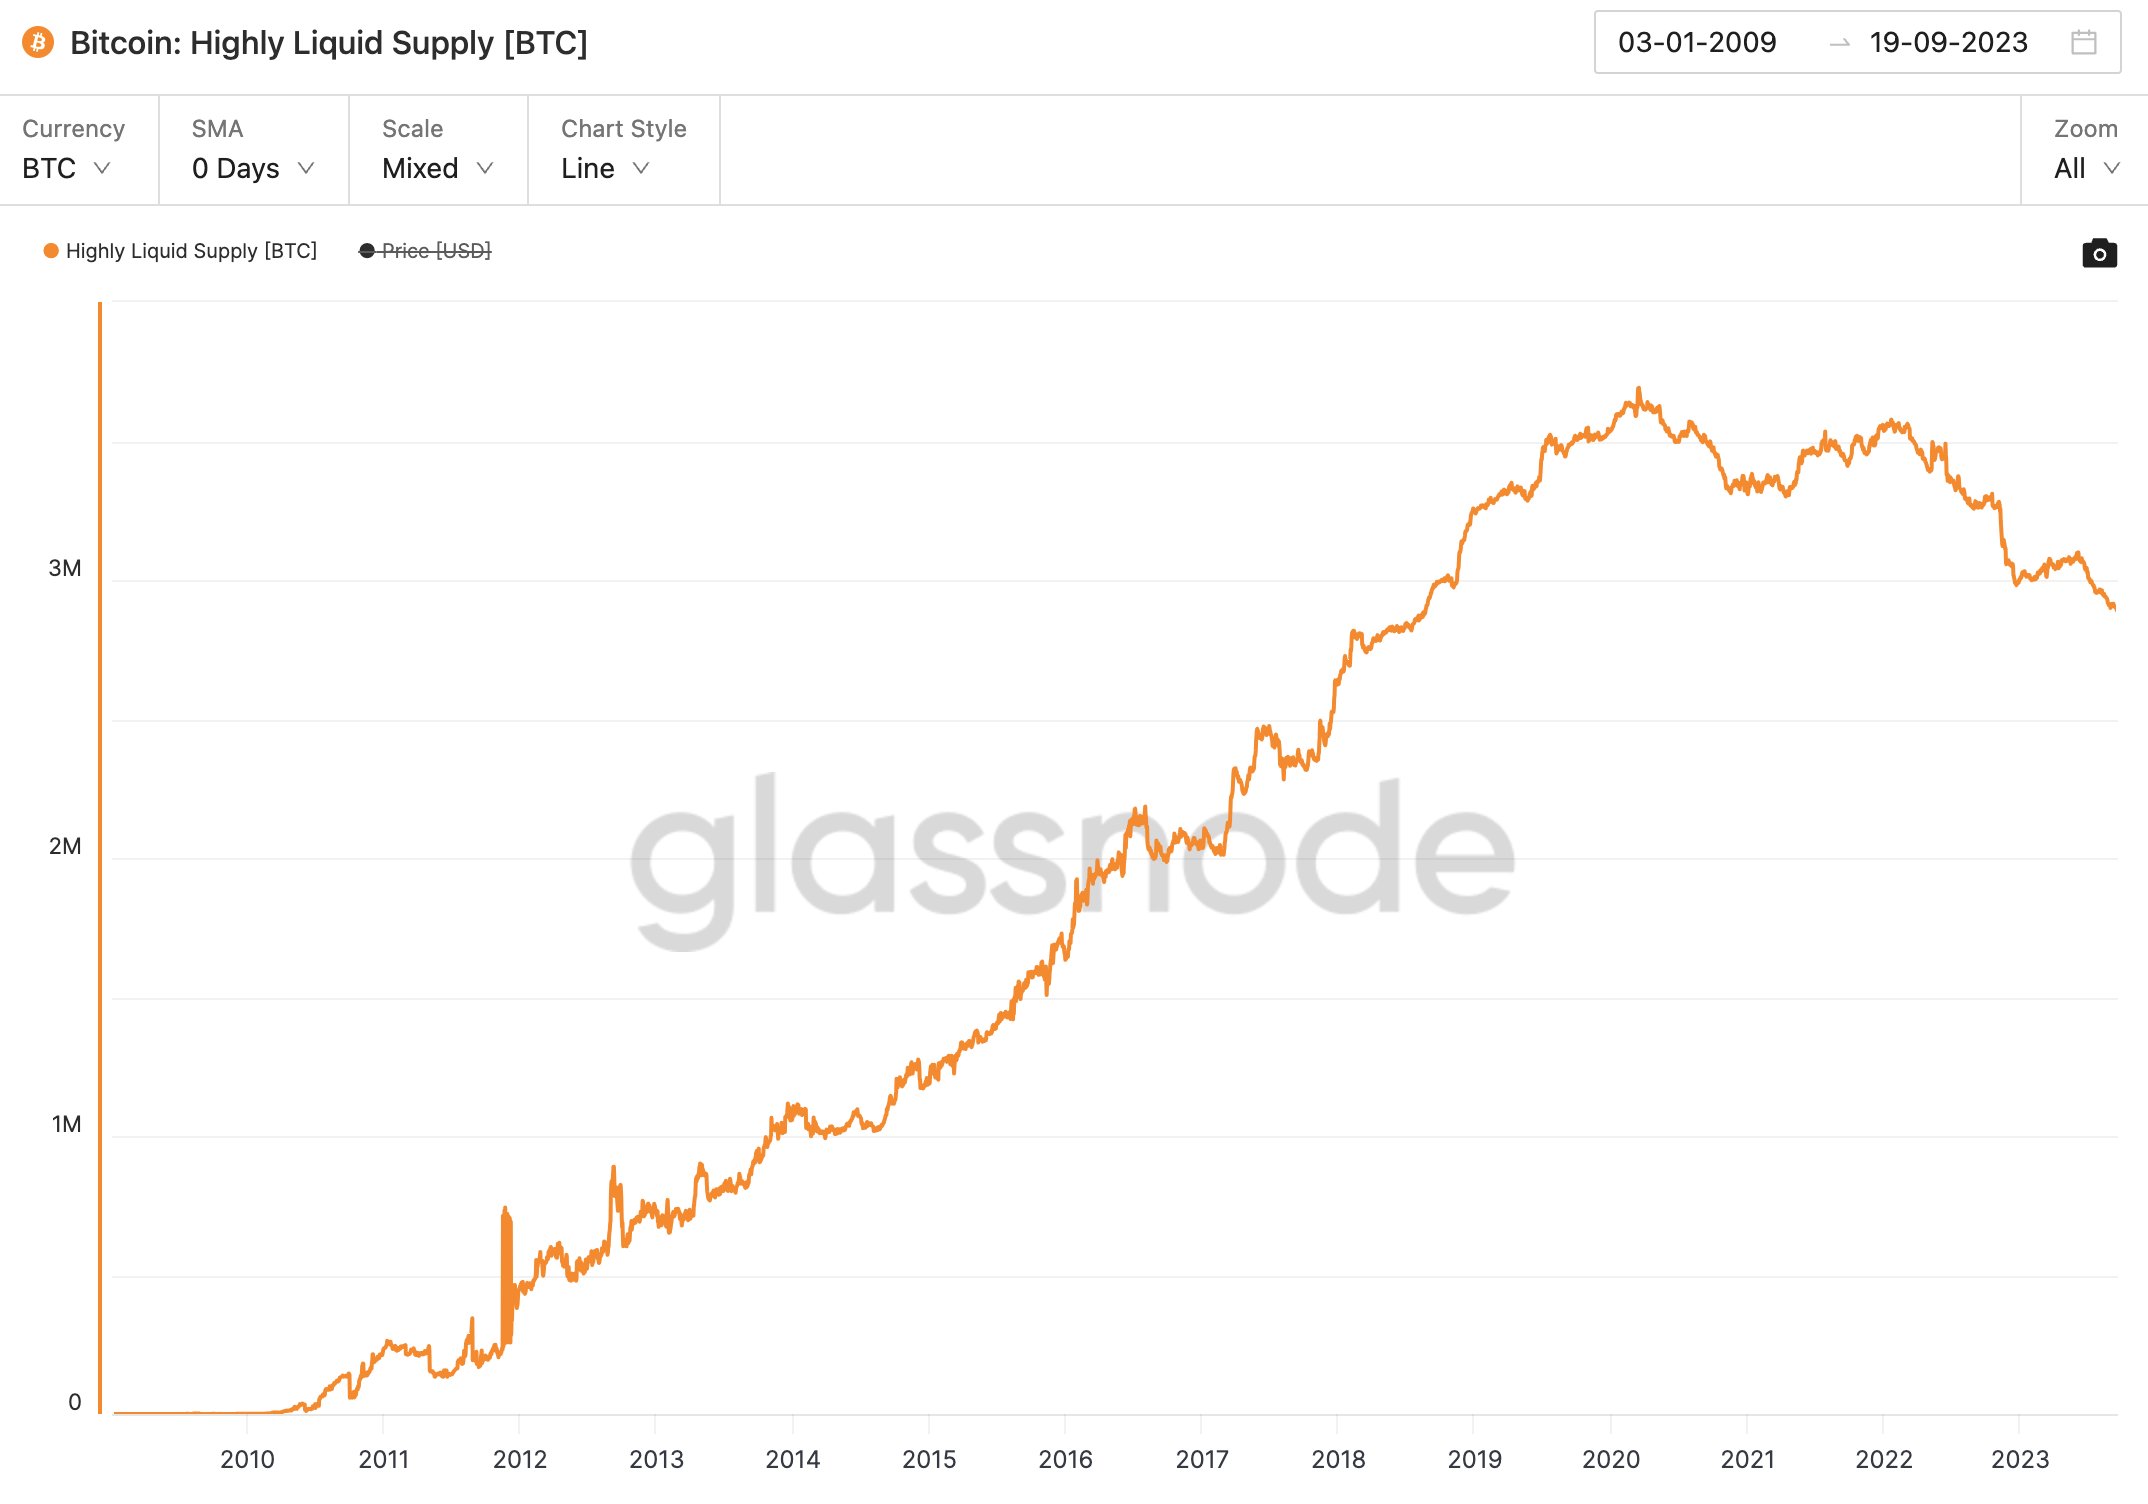
Similarly, the value becomes close to 1 for the highly liquid supply, as investors of this class tend to shift their coins quickly. In the above ratio, Woo has only used this highly liquid supply as a measure of the “real BTC.”
As the chart below shows, this highly liquid Bitcoin supply has been going down recently.
Looks like the value of the metric has been going down in recent years | Source: @woonomic on X
The analyst notes that the less the number of coins in this supply, the more bullish is the outlook for Bitcoin since there are a lesser amount of coins available to be bought.
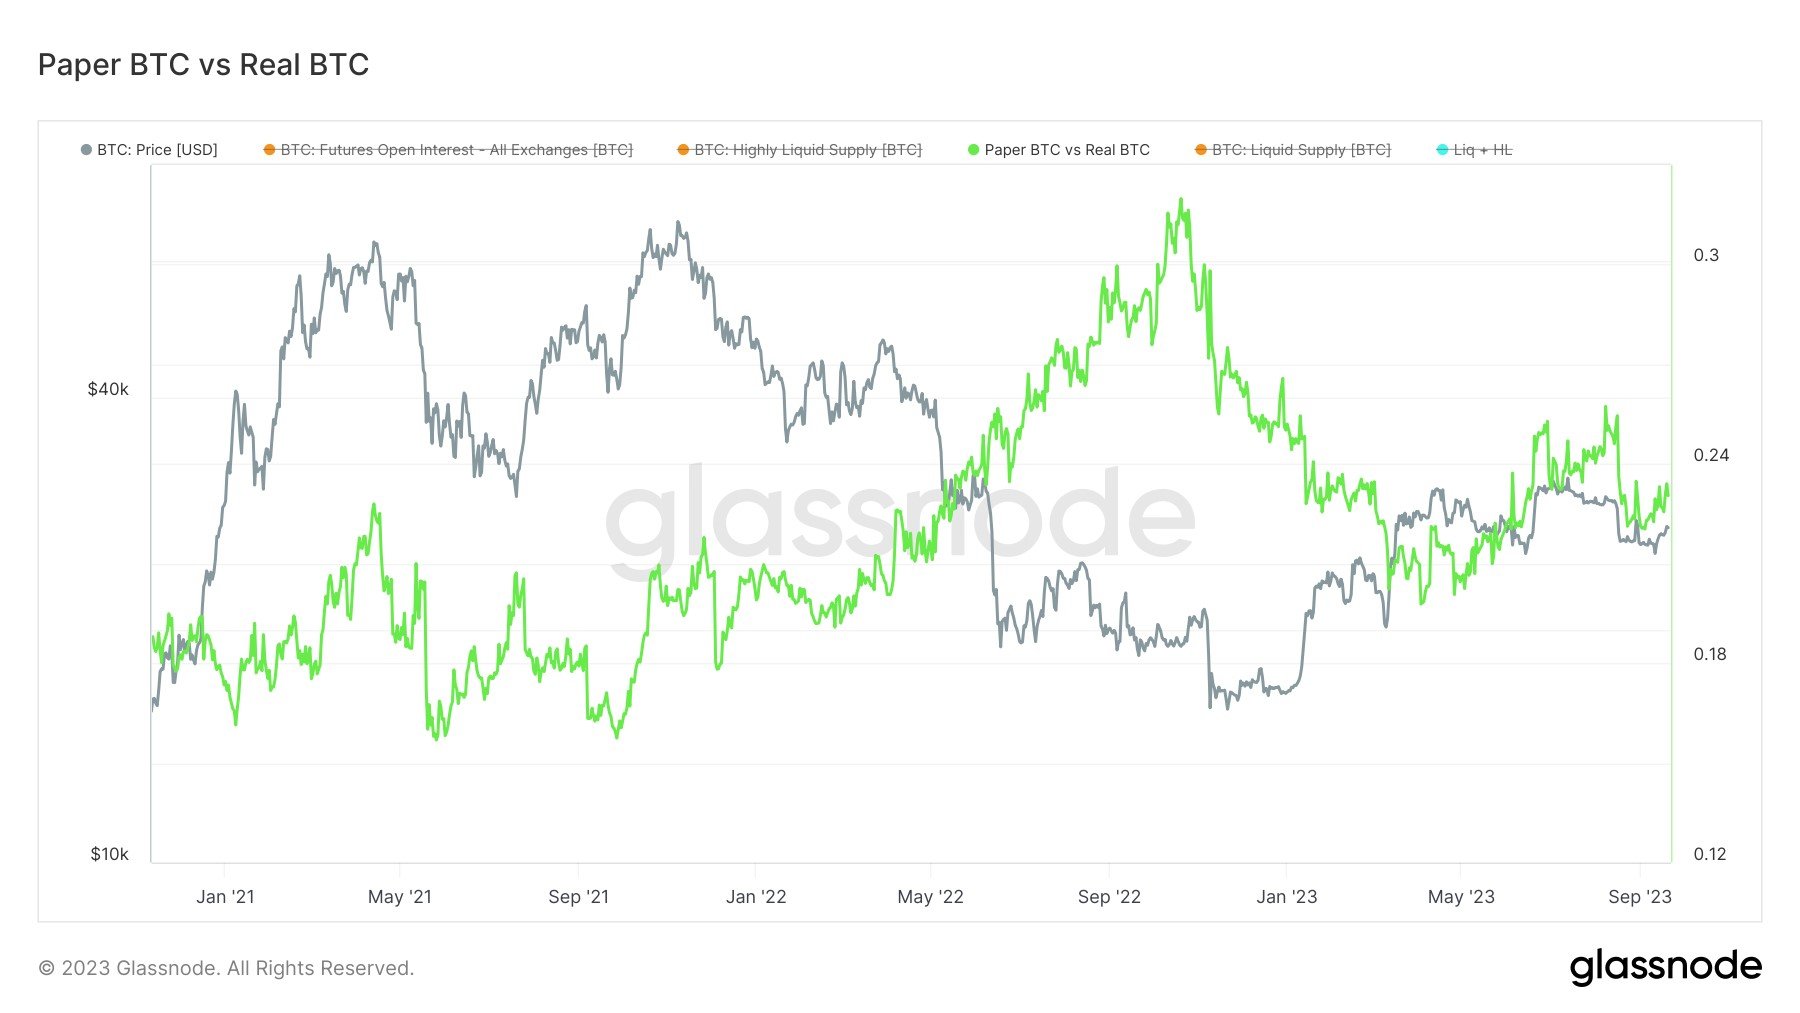
Another analyst, James V. Straten, replied to Woo’s post with a chart that combines the liquid supply into the ratio, which, while less fluid than the highly liquid supply, still constitutes a notable part of the BTC traded supply.
The paper vs real BTC ratio with liquid supply accounted for | @jimmyvs24 on X
According to Straten, the liquid and highly liquid supplies have observed a combined drawdown of 500,000 BTC (around $13.3 billion at the current exchange rate) since May 2023.
However, as the paper BTC is still significantly more than the real BTC, any “supply shock” effects being created out of the real supply becoming less liquid are being more than made up for by the increase in the paper supply.
BTC Price
Bitcoin has registered a sharp decline in the past day, as the coin has lost the $27,000 level and is currently floating around the $26,500 mark.
BTC has dropped during the last 24 hours | Source: BTCUSD on TradingView
Featured image from Kanchanara on Unsplash.com, charts from TradingView.com, Glassnode.com


