Monero price has been bullish despite the broader market trends. Over the last 24 hours, XMR has continued moving up on its chart. It gained close to 4%.
In the past week, Monero price gained significantly as there was a 9% appreciation on the altcoin’s chart. The technical outlook for the coin was bullish on the one-day chart.
Monero has experienced low buying pressure over the past few days. The technical indicator now displayed that buying strength was recovering on the charts, which meant that XMR could be headed close to its next resistance mark.
With increased demand, XMR could hold onto its bullish momentum. The support zone for Monero price was between $146 and $136, respectively.
Bitcoin was also up on the charts, which has helped other altcoins make recoveries on their respective charts.
Monero has to move above the $146 price mark. That could only be possible if the demand for XMR continues to increase and remain consistent.
Monero Price Analysis: One Day Chart
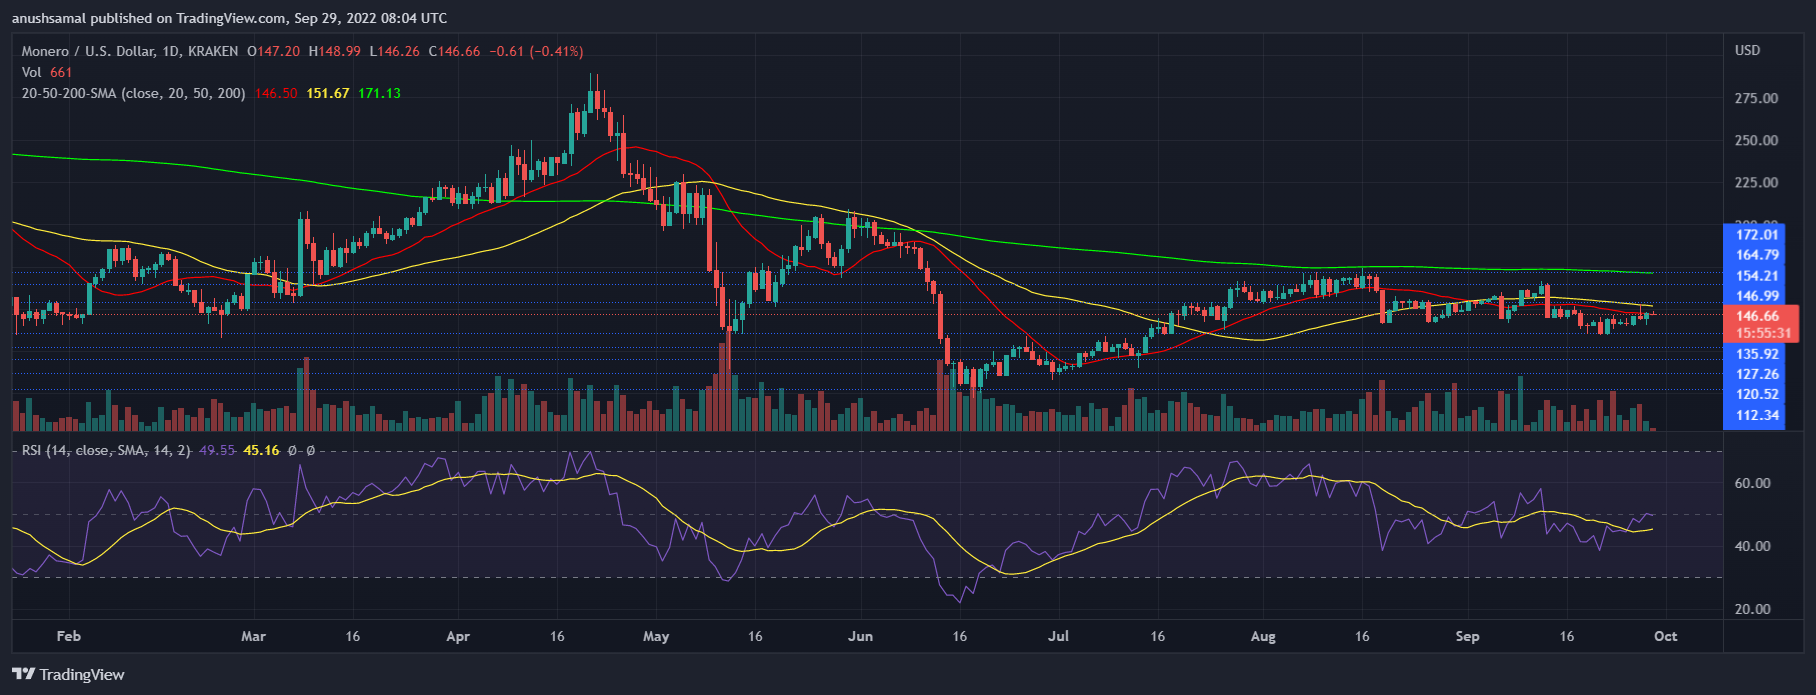
XMR was trading at $146 at the time of writing. The coin’s immediate resistance level was $154. The coin needs to move past that level for the bullish streak to strengthen on the chart.
The other tough price ceiling for Monero price to break past would be $163. The bulls have been rejected at that level for multiple weeks now.
On the flip side, if Monero prices go through a pullback, the first level for Monero would be $134. A fall below the $134 price mark could cause XMR to move down to $127.
The amount of Monero traded in the last trading session decreased, which indicated that selling strength had fallen at the time of writing.
Technical Analysis

XMR’s technical indicators have reflected the increase in buying strength, painting a positive price action. Selling strength on the chart declined, which could help XMR move up on its chart further.
At the moment, the Relative Strength Index moved up near the half-line, and buying strength and selling strength were almost even.
As the indicators displayed, the chart sided with the buyers more. Monero price moved up above the 20-SMA as buying strength recovered. It also meant that buyers were driving the price momentum in the market.

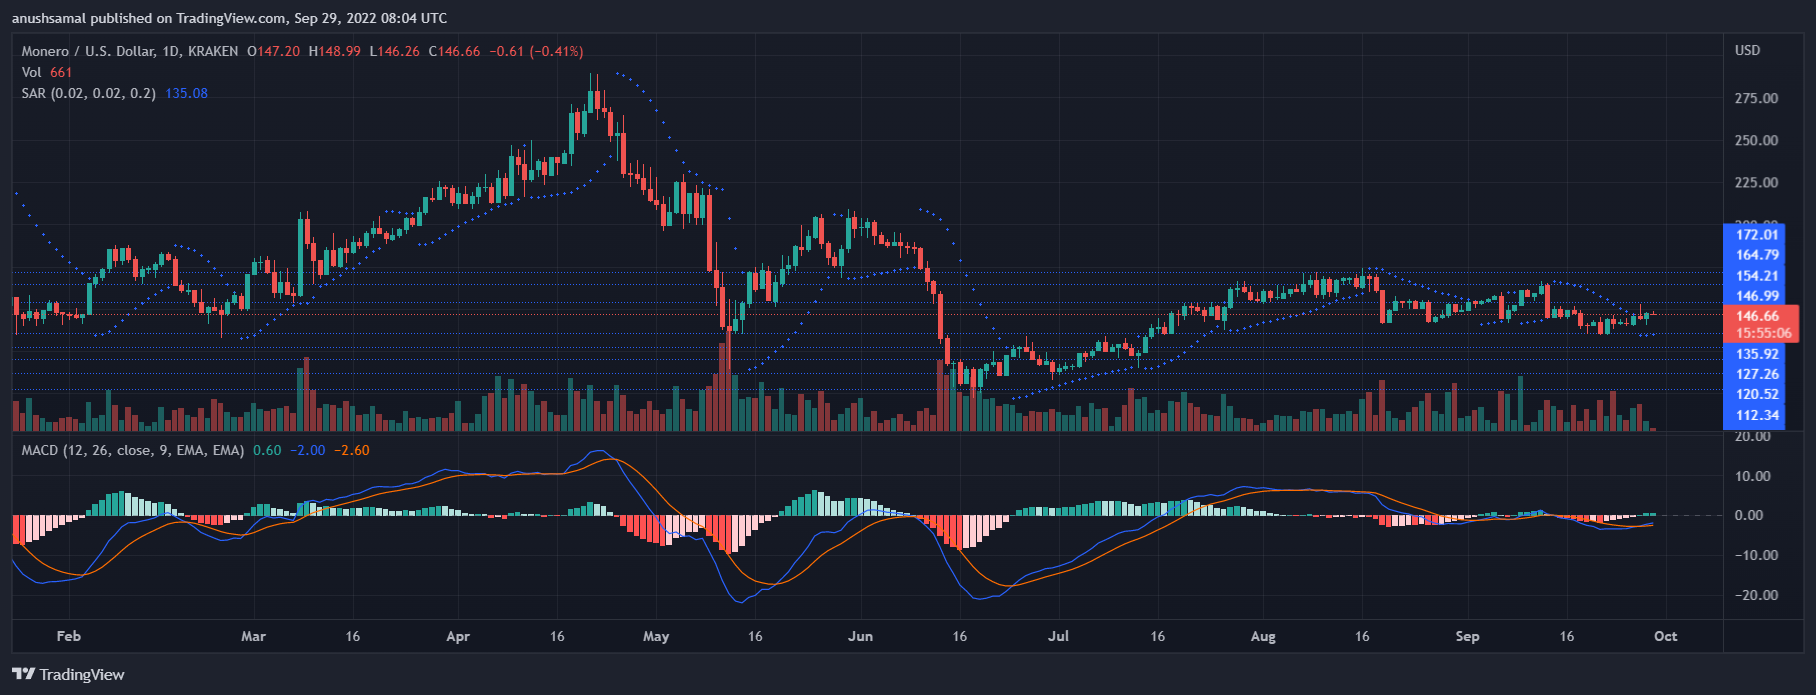
XMR’s other technical indicators are also inclined towards the bullish side. The Moving Average Convergence Divergence indicated the price momentum and overall price action.
The MACD underwent a bullish crossover and formed green signal bars, which was buy signal for the coin. The Parabolic SAR determines the price direction of a particular crypto.
The dotted line below the price candlestick means an upward trend for Monero price.


