Litecoin is leading in today’s gains among top 10 cryptocurrencies. Litecoin outperformed Bitcoin, Bitcoin Cash and Ripple by weekly gains. There are no significant updates and news related to Litecoin, except listing on Paypal, hence the price action is mainly related to speculation by traders and general crypto market sentiment.
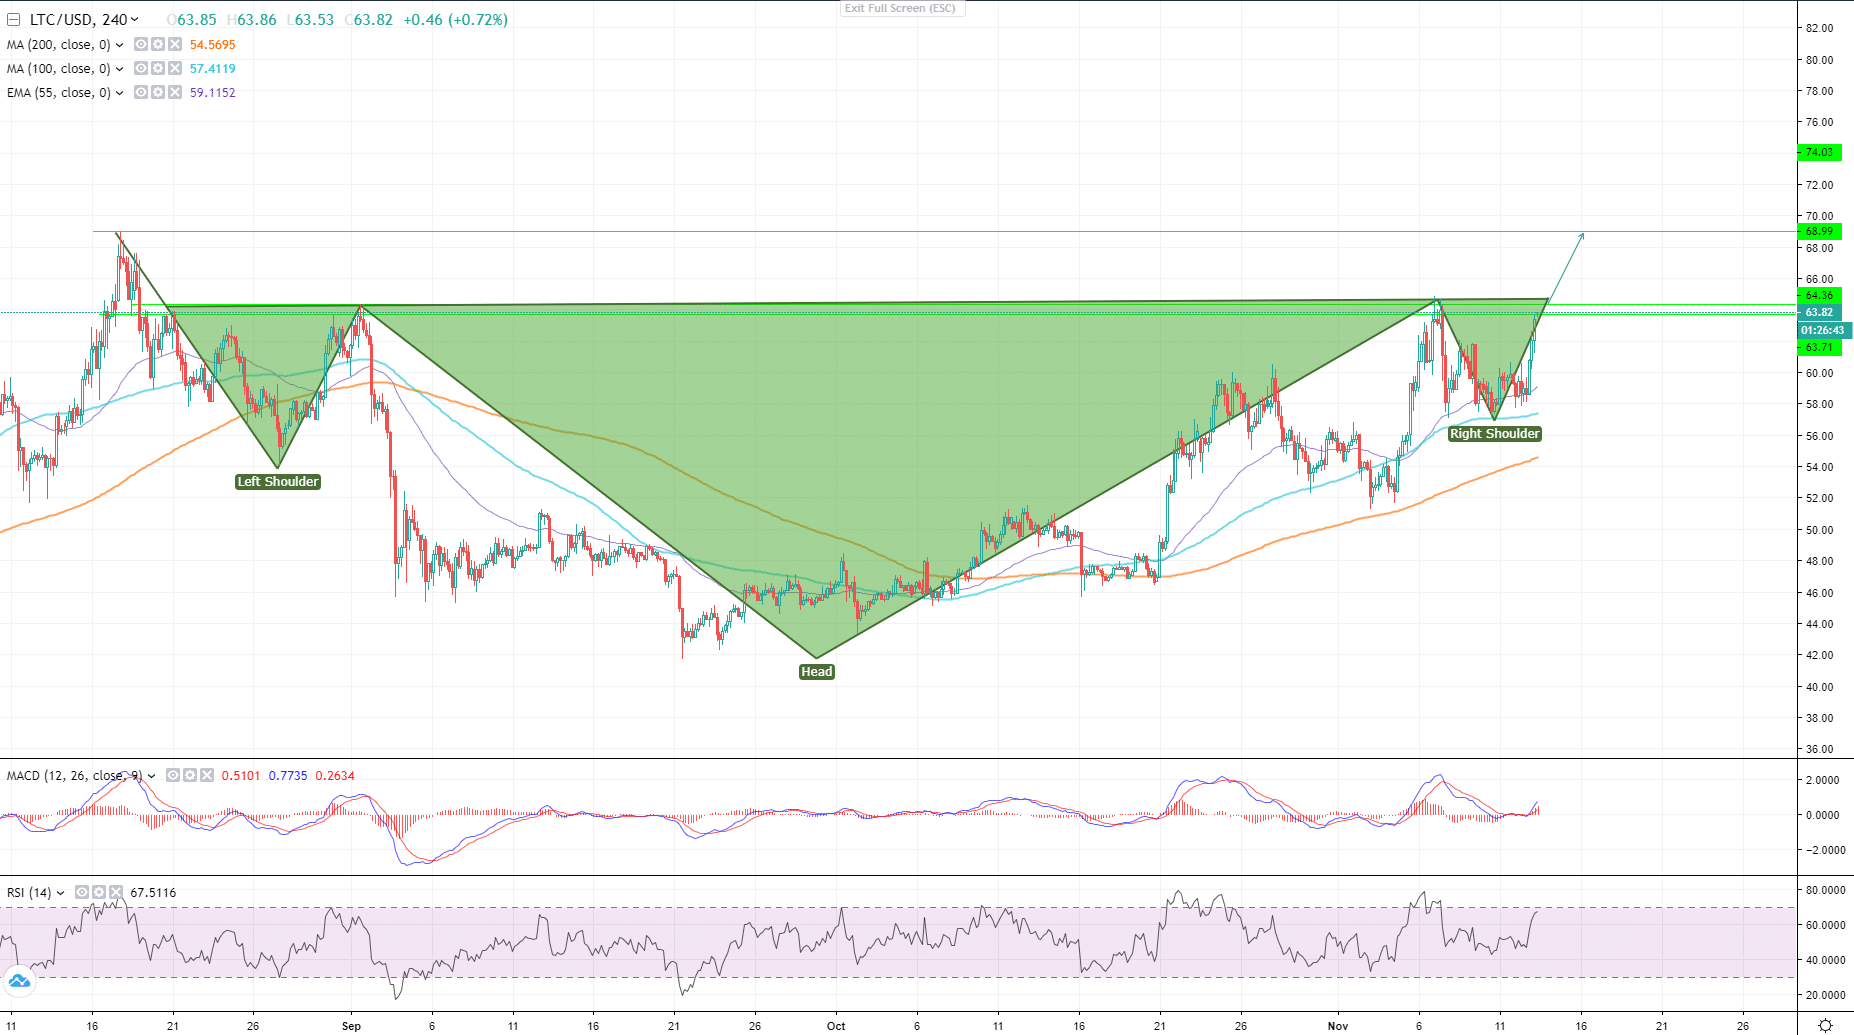
By the time of writing this article, LTC/USD is traded at $64.11 and has penetrated an important resistance of $64. The continuation of the uptrend is supported by two Moving averages, Simple moving average 100 and an Exponential Moving Average 55 on a 4-Hour chart.
There are also two chart patterns to watch, when the breakout from the $64 resistance is broken, the most obvious currently remains – Cup and Handle pattern.
Another pattern to watch is an Inverted Head and Shoulders.
If Litecoin actually fails to overtake the resistance, it will probably drop to the nearest support levels, which are located at $59.36 and $56.79.
For the short and mid-term, Litecoin will continue to climb inside this parallel channel. It’s worth to mention that Moving Averages 100 and 200 are both following the levels of the Pitchfork, which is a great support for LTCUSD. Despite RSI indicating that the pair is near oversold, MACD is above the signal line and signals the bullish trend.

Senior Vice President at Overbit. Technical analyst, crypto-enthusiast, ex-VP at TradingView, medium and long-term trader, trades and analyses FX, Crypto and Commodities markets.


