After the FTX crash on November 9, Litecoin’s price began a significant upward price movement. Investors continue to remain in profit. However, a downswing could be on the way. This might not necessarily be the end of the bulls just yet.
Although LTC is moving south after registering a 7.1% fall on the daily chart, regarding weekly gains, the Litecoin price has held onto its 16% appreciation. The bears have now entered the market and halted the uptrend.
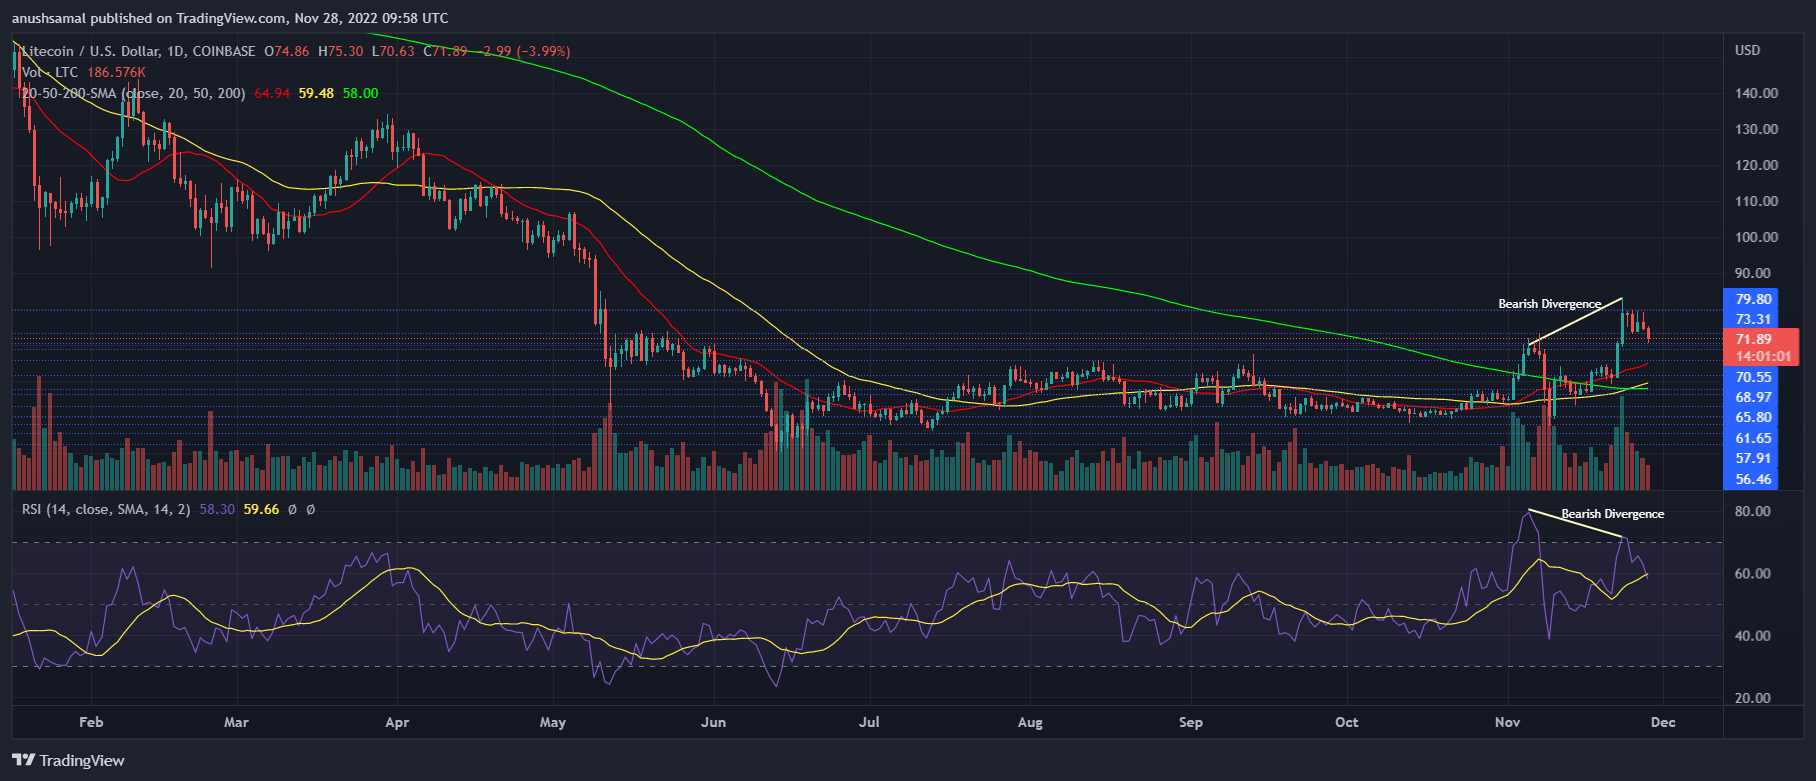
A jump above the immediate resistance mark over the next trading session will pause the bears again. On the daily chart, the Litecoin price has formed a bearish divergence. This often signals an incoming sell-off in the market. Since buyers continue to overpower sellers on the chart, a recovery from the sell-off should not be difficult. A move above the $75 mark can also fuel another rally.
Related Reading: Bitcoin Bottom Is Near, But A Drop To This Level Is Possible, Renowned Analyst Says
Litecoin Price Analysis: One-Day Chart
LTC was auctioning for $71 at press time. Over the last 24 hours, LTC displayed that its week-old bullish momentum was waning. Immediate resistance for the coin stood at $73. If buyers remain present, the coin might revisit the aforementioned level.
It remains to be seen if LTC can stay above $73. On the other hand, a fall from the $73 price mark can drag the altcoin to $65. Since investors are still optimistic about LTC, recovery should be swift. In that event, Litecoin can fall to $61 and then to $58. A quick recovery could propel the altcoin’s price to $93, and then LTC could reach the psychological price ceiling of $100.
Technical Analysis

The technical outlook of LTC has remained optimistic and is yet to capture the recent bearish sentiments. LTC, however, has formed a bearish divergence on the chart. Bearish divergence is followed by a sell-off. The Relative Strength Index noted a downtick and was below the 60-mark, indicating that buyers are decreasing in number but are still outnumbering sellers.
The price of Litecoin was pictured above the 20-Simple Moving Average as the coin still remains profitable. Buyers were driving the price momentum. This also pointed out that Litecoin should be able to bounce back soon in case of a sell-off.

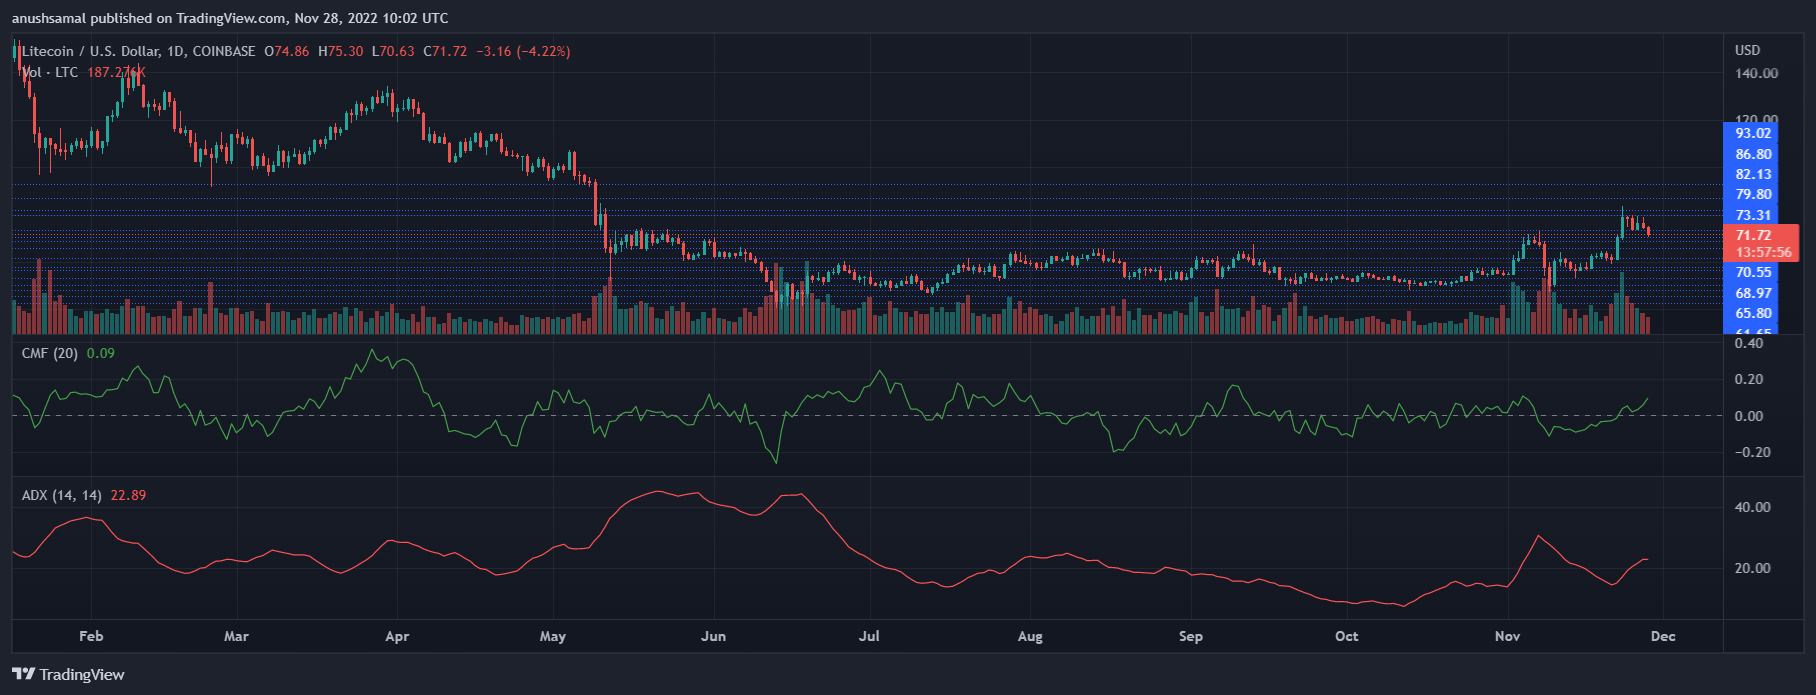
Litecoin’s indicators depicted the same outlook in correspondence with more buyers than sellers. The Chaikin Money Flow, which indicates capital inflows, was above the half-line, which meant that investors were accumulating the altcoin.
The Average Directional Index also sided with the buyers; it depicts the strength of the price momentum. ADX was slightly above the 20-mark, which meant that the price momentum was gaining strength at the time of writing.
Related Reading: Dogecoin Climbs 25%, Leads Top 10 Coins, In Last 7 Days – Can It Hit $1 By 2023?
Featured image from Unsplash, Chart: TradingView.com


