Bitcoin (BTC) had a tremendous 2020 as the BTC price rallied by 311% in 2020. In the shadows of Bitcoin, Ether (ETH) has also been seeing a fantastic year as Ether’s price rallied by an even bigger 475%. While only five days into the new year, ETH is continuing this trend.
Bitcoin breaking new all-time highs above $30,000 has sparked a massive rally fire that is now spilling over to altcoins. However, the question now is whether the bull run will be continuing vertically, as in the past few months, or whether a short-term correction should be expected.
Such a correction would open the gates for most cryptocurrencies to follow Bitcoin toward their own respective all-time highs.
Bitcoin must sustain the 21-week MA

There are not many indicators to watch for the continuation of this bull market as only a few give you strong enough arguments for bull/bear cases.
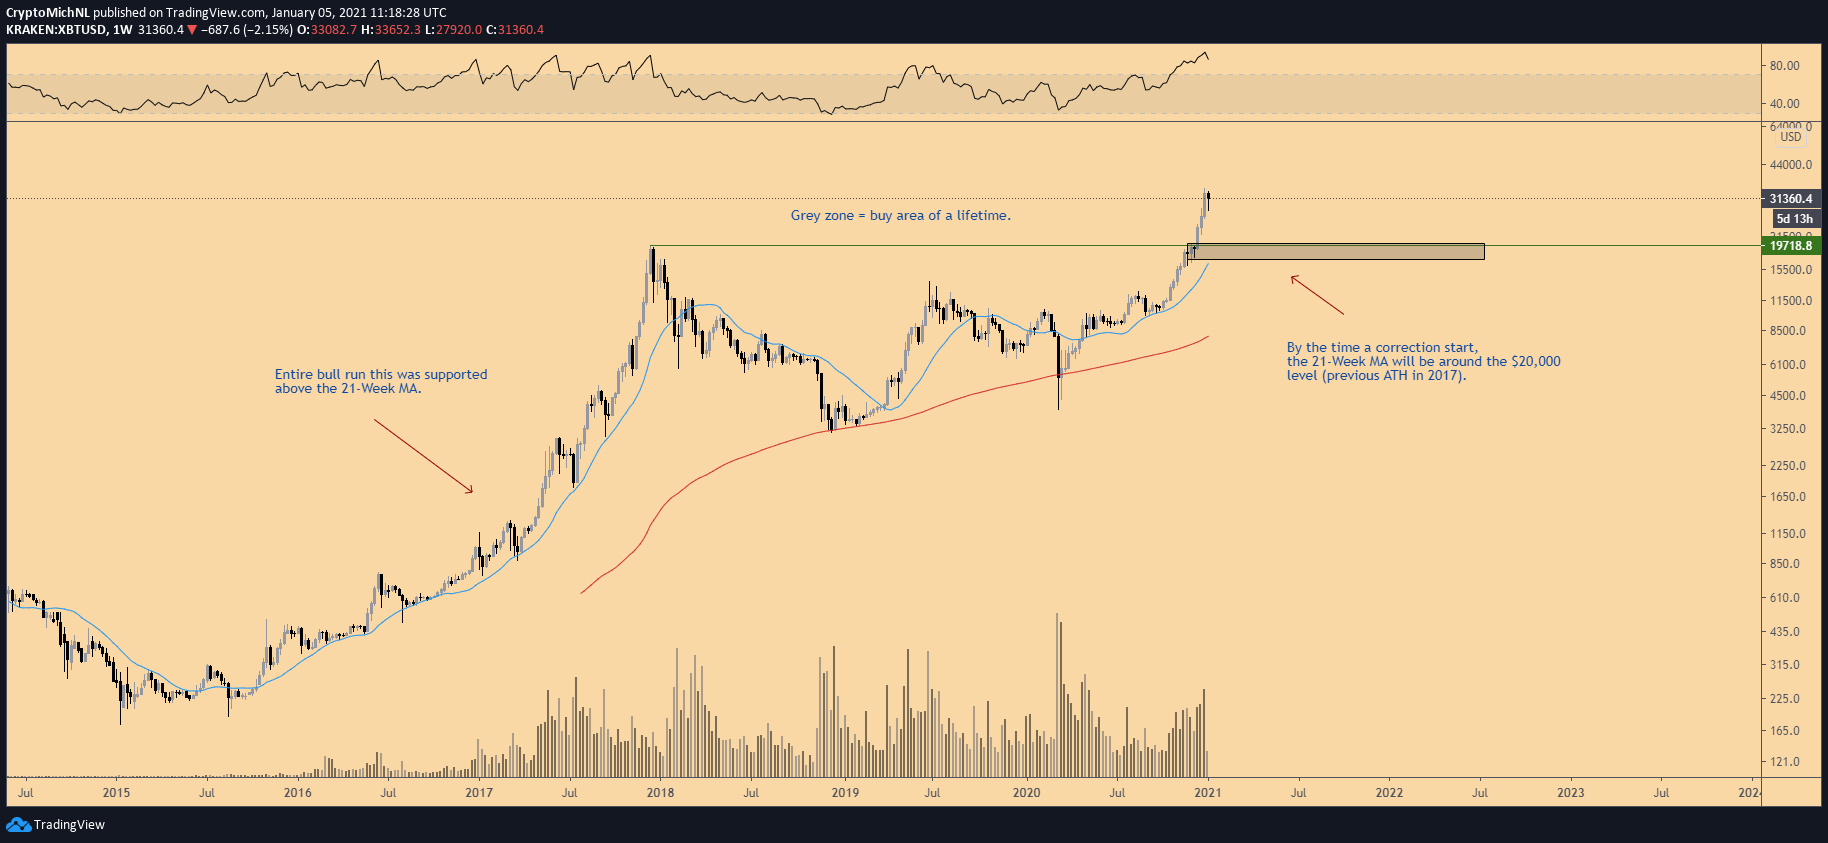
But one useful indicator is the 21-Week Moving Average (MA). This MA served as support throughout the previous bull run, which indicated the continuation towards a peak high at $20,000.
As long as Bitcoin rests on this MA, further continuation is likely for the BTC/USD pair. At this moment, the 21-Week MA is holding support at the $16,000 level.
However, corrections are common with consolidations that could span the next few weeks. During those weeks, the 21-Week MA is going to crawl upward. Therefore, combining the future perspective of the 21-week MA with the previous all-time high gives an ultimate bottom for a correction at the $20,000 region.

Whether Bitcoin has topped out for now is up for debate, as BTC is many bullish signals are still flashing. This bullish price action is combined with the constant outflow from exchanges, a bullish signal for the market. These Bitcoins are likely to be held for the longer term, which makes this bull cycle very different from the bull run of 2017.
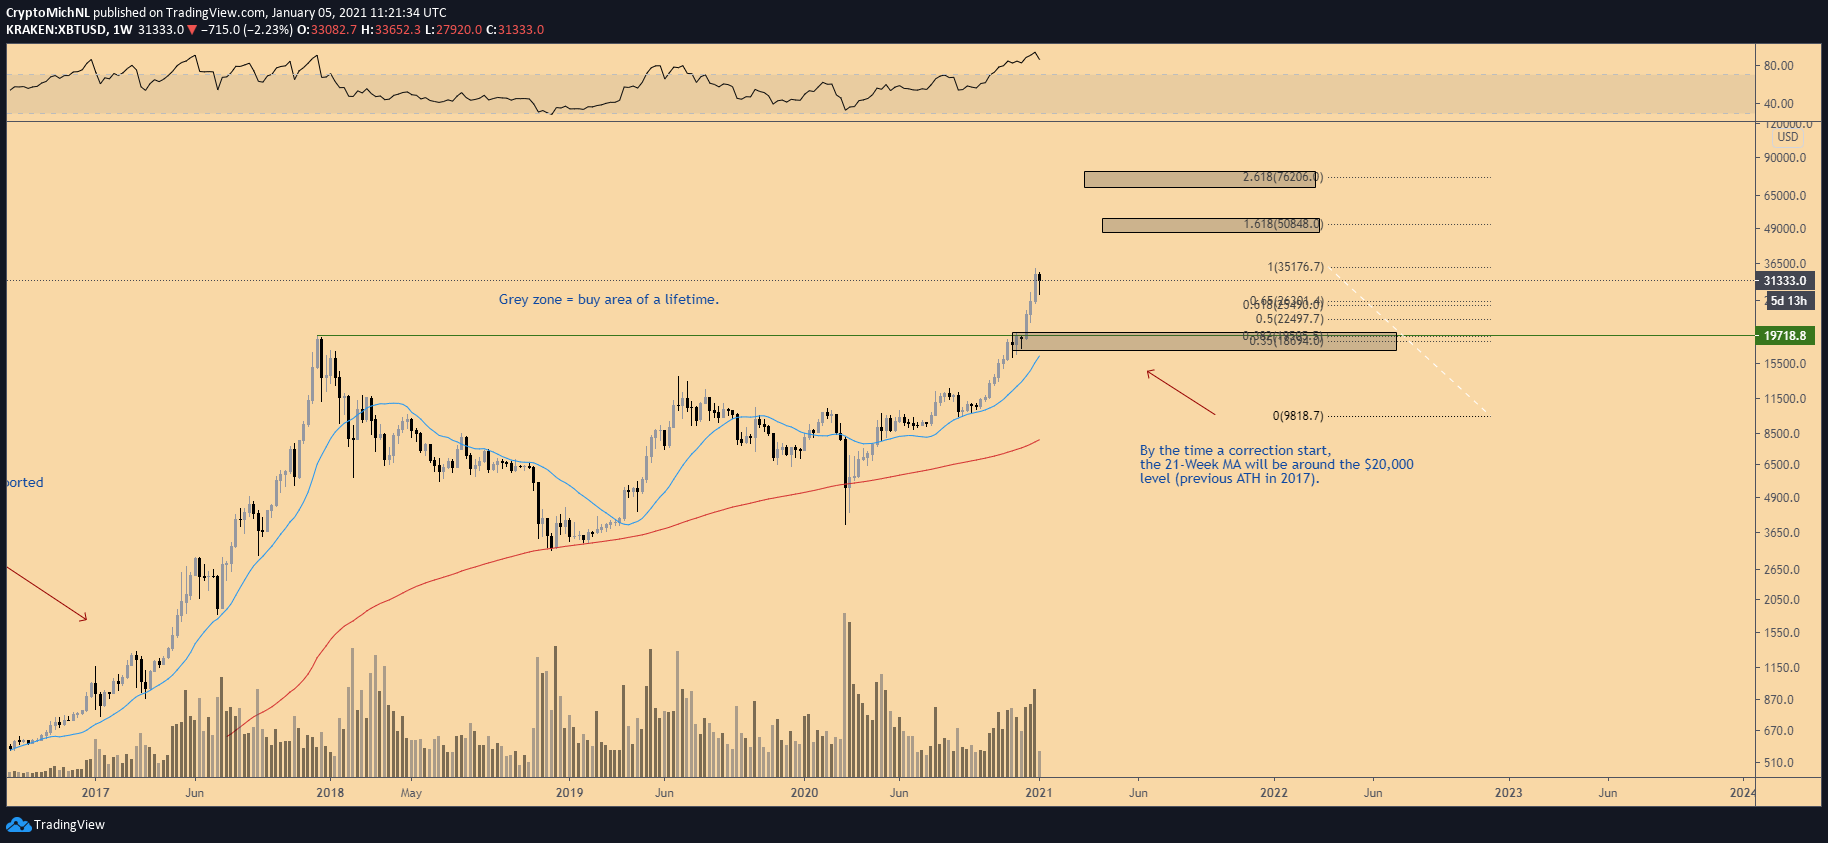
Using the Fibonacci extension tools, the continuation of the current rally puts the next levels of interest at the 1.618 and 2.618 Fibonacci levels, where the next big corrections could happen. Those levels are currently lying at $50,000 and $76,000.
However, it won’t be a surprise if Bitcoin runs toward $76,000 this year given its recent strength.
Total crypto market cap breaking new highs

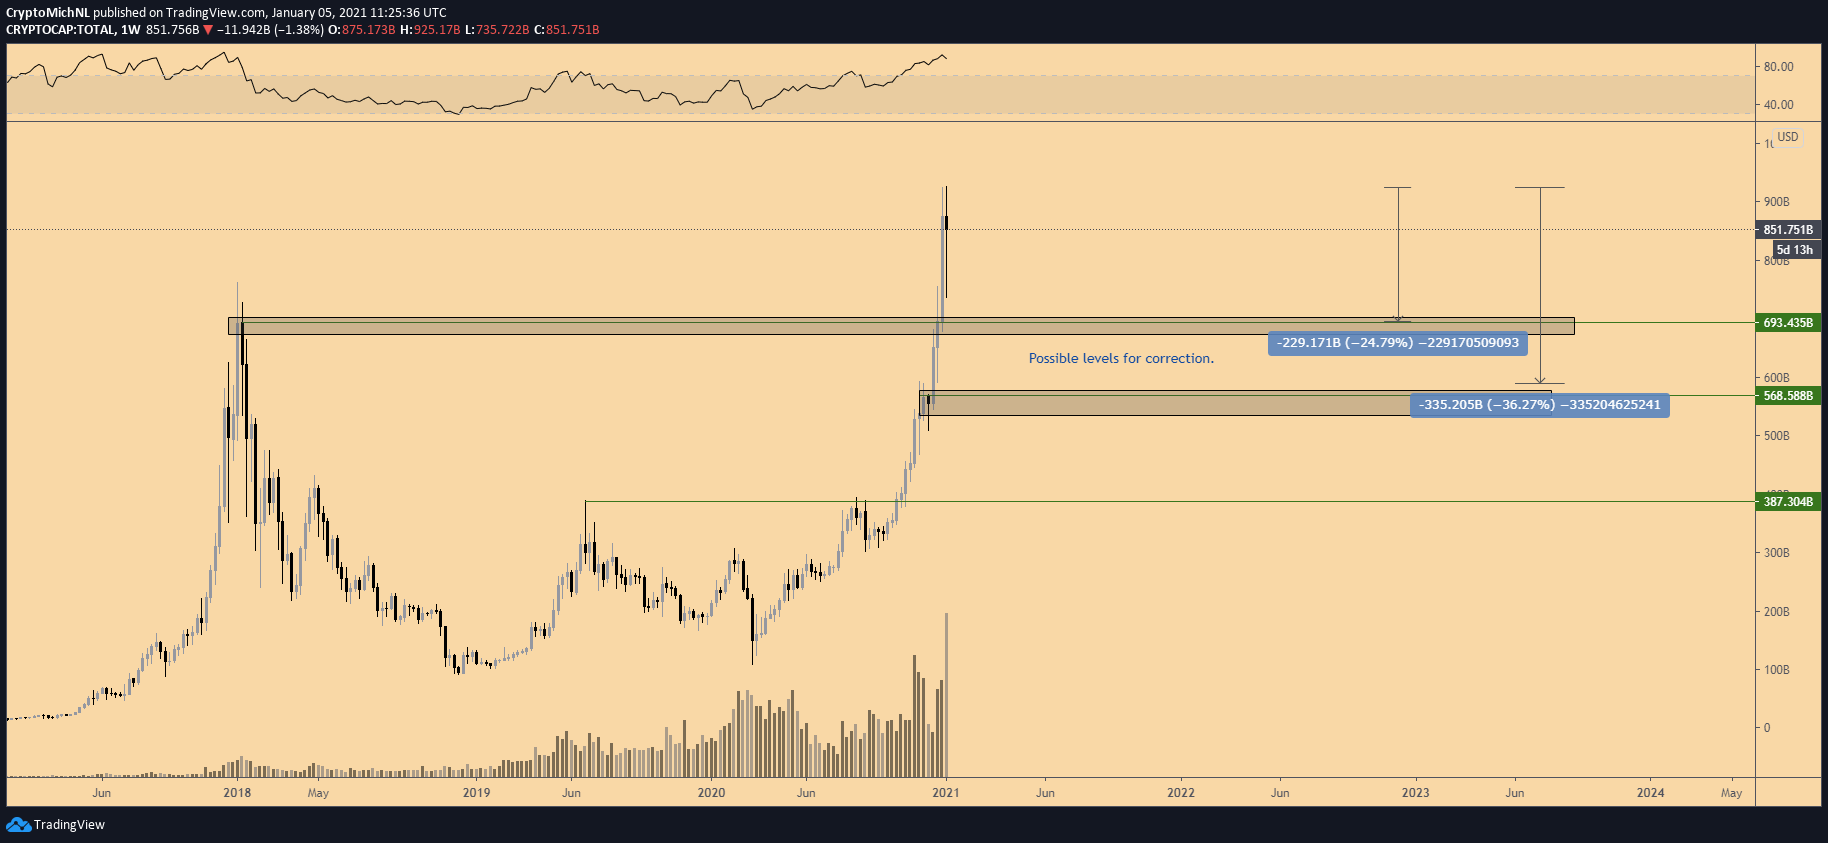
The total market capitalization is also making new all-time highs since Bitcoin and Ethereum have been doing tremendously in recent weeks. The altcoin market capitalization has been lagging heavily since Bitcoin often pulls out ahead. But once Bitcoin stabilizes, many other cryptocurrencies tend to follow suit with sharp rallies.
This happens because of how money flows through the markets. First, Bitcoin being in the spotlight attracts capital flows. Then as investors seek even higher risk-reward opportunities, the money flows toward the large caps, mid-caps, and so forth.
However, in case of a consolidation, the levels to watch for the total market cap are shown in the chart. It’s the previous all-time high around $700 billion (which might have seen a test already) and the area around $550 billion.
Which are the levels to watch on lower time frames?

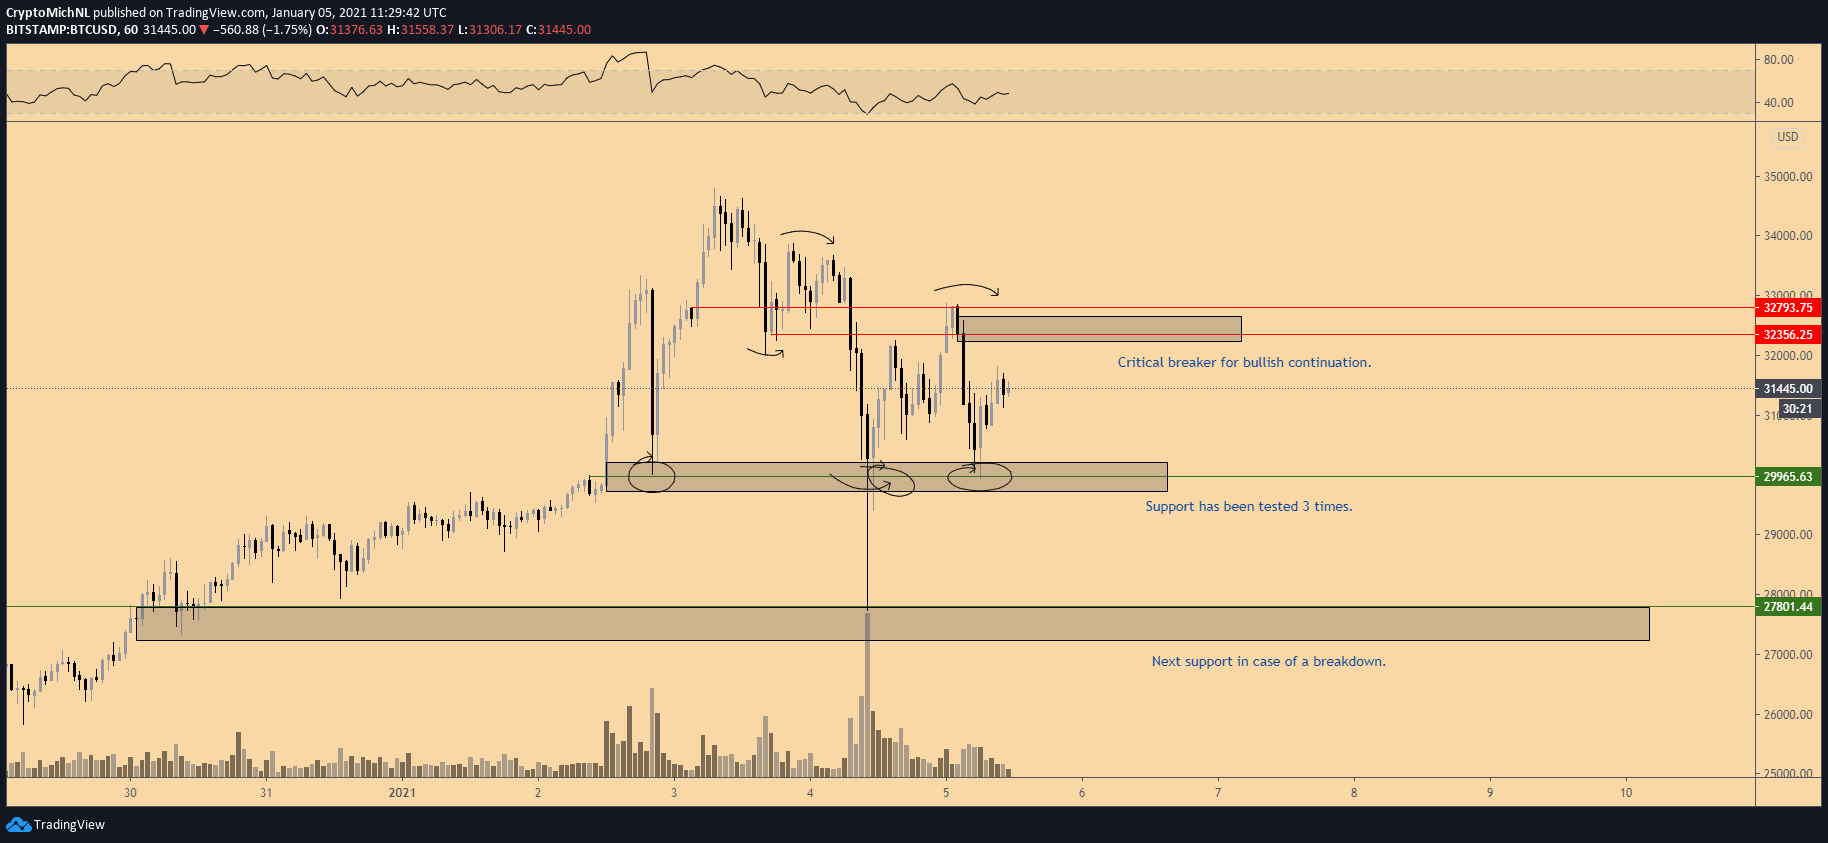
The hourly chart for Bitcoin shows a slight downturn since the recent peak high at $34,800. The $32,400-32,800 flipped resistance, which is often a bearish signal.
However, the $30,000 barrier has served as support three times already. Therefore, this is the crucial area to hold to warrant further upward momentum. If this level breaks down as support, a drop toward $27,000-27,500 then becomes likely.
If it holds, continuation toward the critical breaker on the upside is likely. In that way, a breakthrough of $32,300-32,800 would warrant a new test of the all-time high region and possible continuation toward $38,000 and even $42,000.
The views and opinions expressed here are solely those of the author and do not necessarily reflect the views of Cryptox. Every investment and trading move involves risk. You should conduct your own research when making a decision.


