When crypto traders win big, they often take to Twitter to share the joy. They tend to do the same for sharing painful stories of getting wrecked, discussing promising new assets, or sharing insight and predictions on which projects can become the next big thing. Sometimes these waves of social attention can even create positive feedback loops whereby the tokens that command the chatter see their prices soar precisely for that reason.
The volume of tweets referencing a particular asset can indicate a lot of different things. This month, the five tokens that saw the greatest month-to-month increases in daily tweet volume — Loopring’s LRC, NuCypher’s NU, Enjin Coin (ENJ), ANKR and The Sandbox’s (SAND) — also saw some of the heftiest monthly gains. This in itself is not at all shocking, as the assets that see huge rallies tend to attract the Twitter crowd’s attention.
What is remarkable, however, is that in all five cases, the record-breaking tweet volume peaks were actually registered not in response to monthly price highs but ahead of them. In other words, the sprawling Twitter conversations around these coins anticipated price action rather than followed it. How could traders catch the signs of this extraordinary social activity early?
Heads-up from the crowd
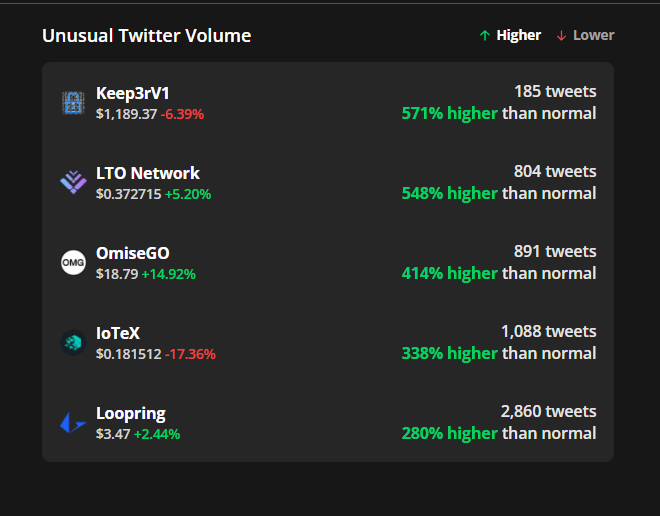
If you do not follow just about everyone on Crypto Twitter, there are few ways to reliably capture each surge in tweets around a particular asset. Subscribers of Markets Pro, Cryptox’s proprietary data intelligence platform, have it easy: A dedicated panel featuring five assets that are seeing an unusually high tweet volume is helpfully displayed in real time right on the dashboard.
Furthermore, tweet volume is one of several metrics used to calculate the VORTECS™ Score, an algorithmic indicator that compares patterns of past market and social activity around a digital asset with years’ worth of historical data performance to evaluate how bullish the coin’s outlook is.
In the case of the top Twitter darlings of the month, a look at raw Twitter data would be sufficient, as all of these coins appeared on the Unusual Twitter Volume panel as their tweet volume peaked.
LRC/USD: A 744.44% increase in tweet volume followed by a +350.79% monthly price change
One of the ingredients of the monstrous rally of LRC this month is the fact that the layer-two protocol continues to offer lower transaction fees compared with its counterparts, which comes in handy amid exorbitant gas fees on the Ethereum network.
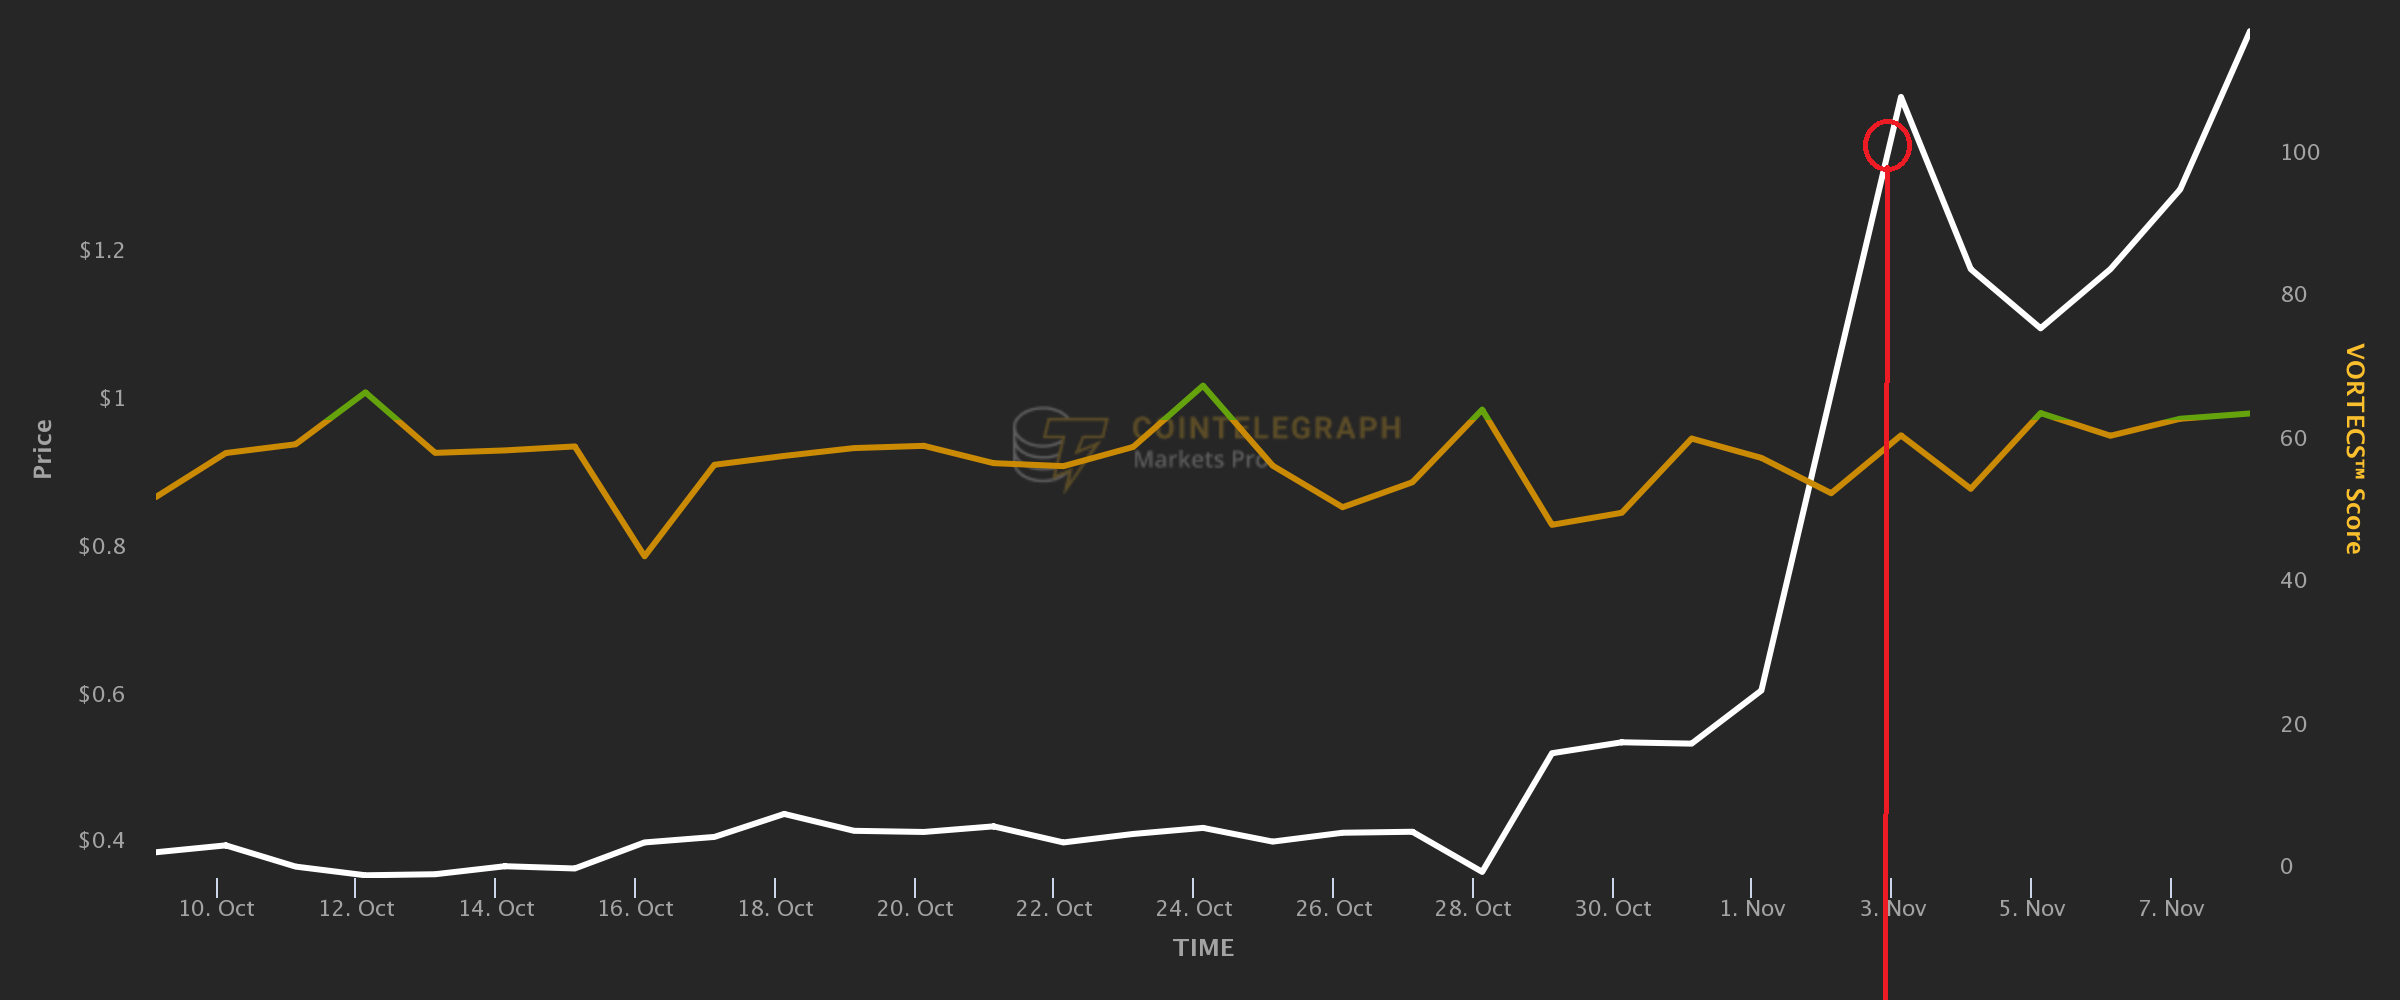
Having surpassed 3,000, the volume of daily tweets mentioning the project exceeded the monthly average by more than 740% on Nov. 3 (the red circle in the chart) as the asset was nearing the local price peak at $1.54. After a brief correction, fueled by the influx of social attention, LRC continued to climb even higher, breaching $2 six days later.
NU/USD: A 598.87% increase in tweet volume triggered a +179.18% monthly price change
Nobody knows for sure where NU’s 10x-plus pump on Oct. 15 came from, but it saw the coin pop from around $0.30 to above $3 in just a few hours. Some Twitter users credited its listing on South Korean exchange Upbit for the uptick, yet chances are there could have been something else at play. Most likely, people were simply trying to figure out what was going on.
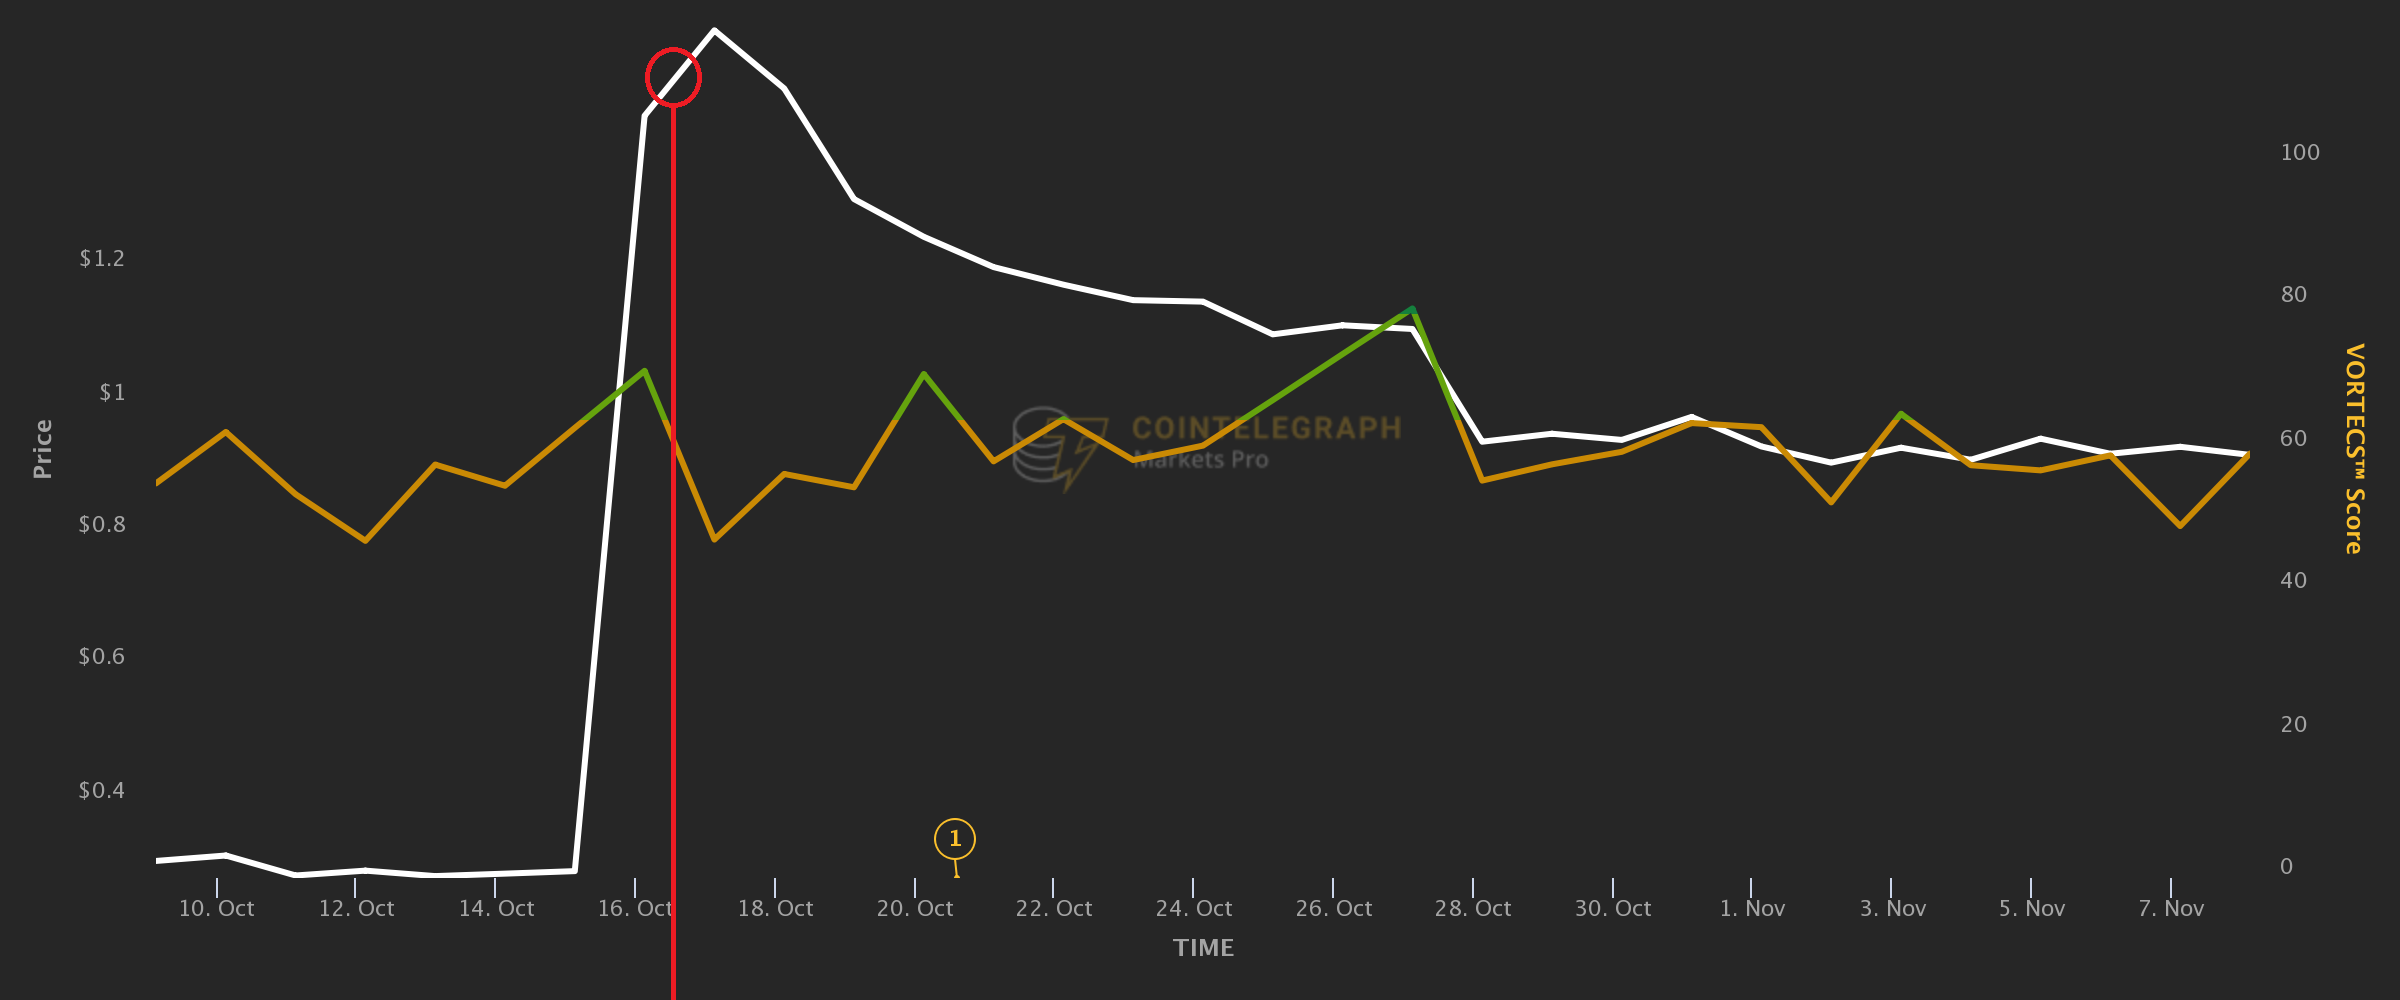
At any rate, the Unusual Twitter Volume indicator began to flash just two hours into the rally, with the highest rate showing up shortly before the price high of $3.17. Interestingly, social excitement around NU persisted for some time after the hard price correction, beginning to wane only a day after the price crumbled back to around $1.20.
ENJ/USD: A 354.32% surge in tweet volume accompanied a +90.35% monthly price change
Enjin Coin emerged as one of the beneficiaries of the metaverse tokens’ spree triggered by Facebook’s rebrand to Meta at the end of October.
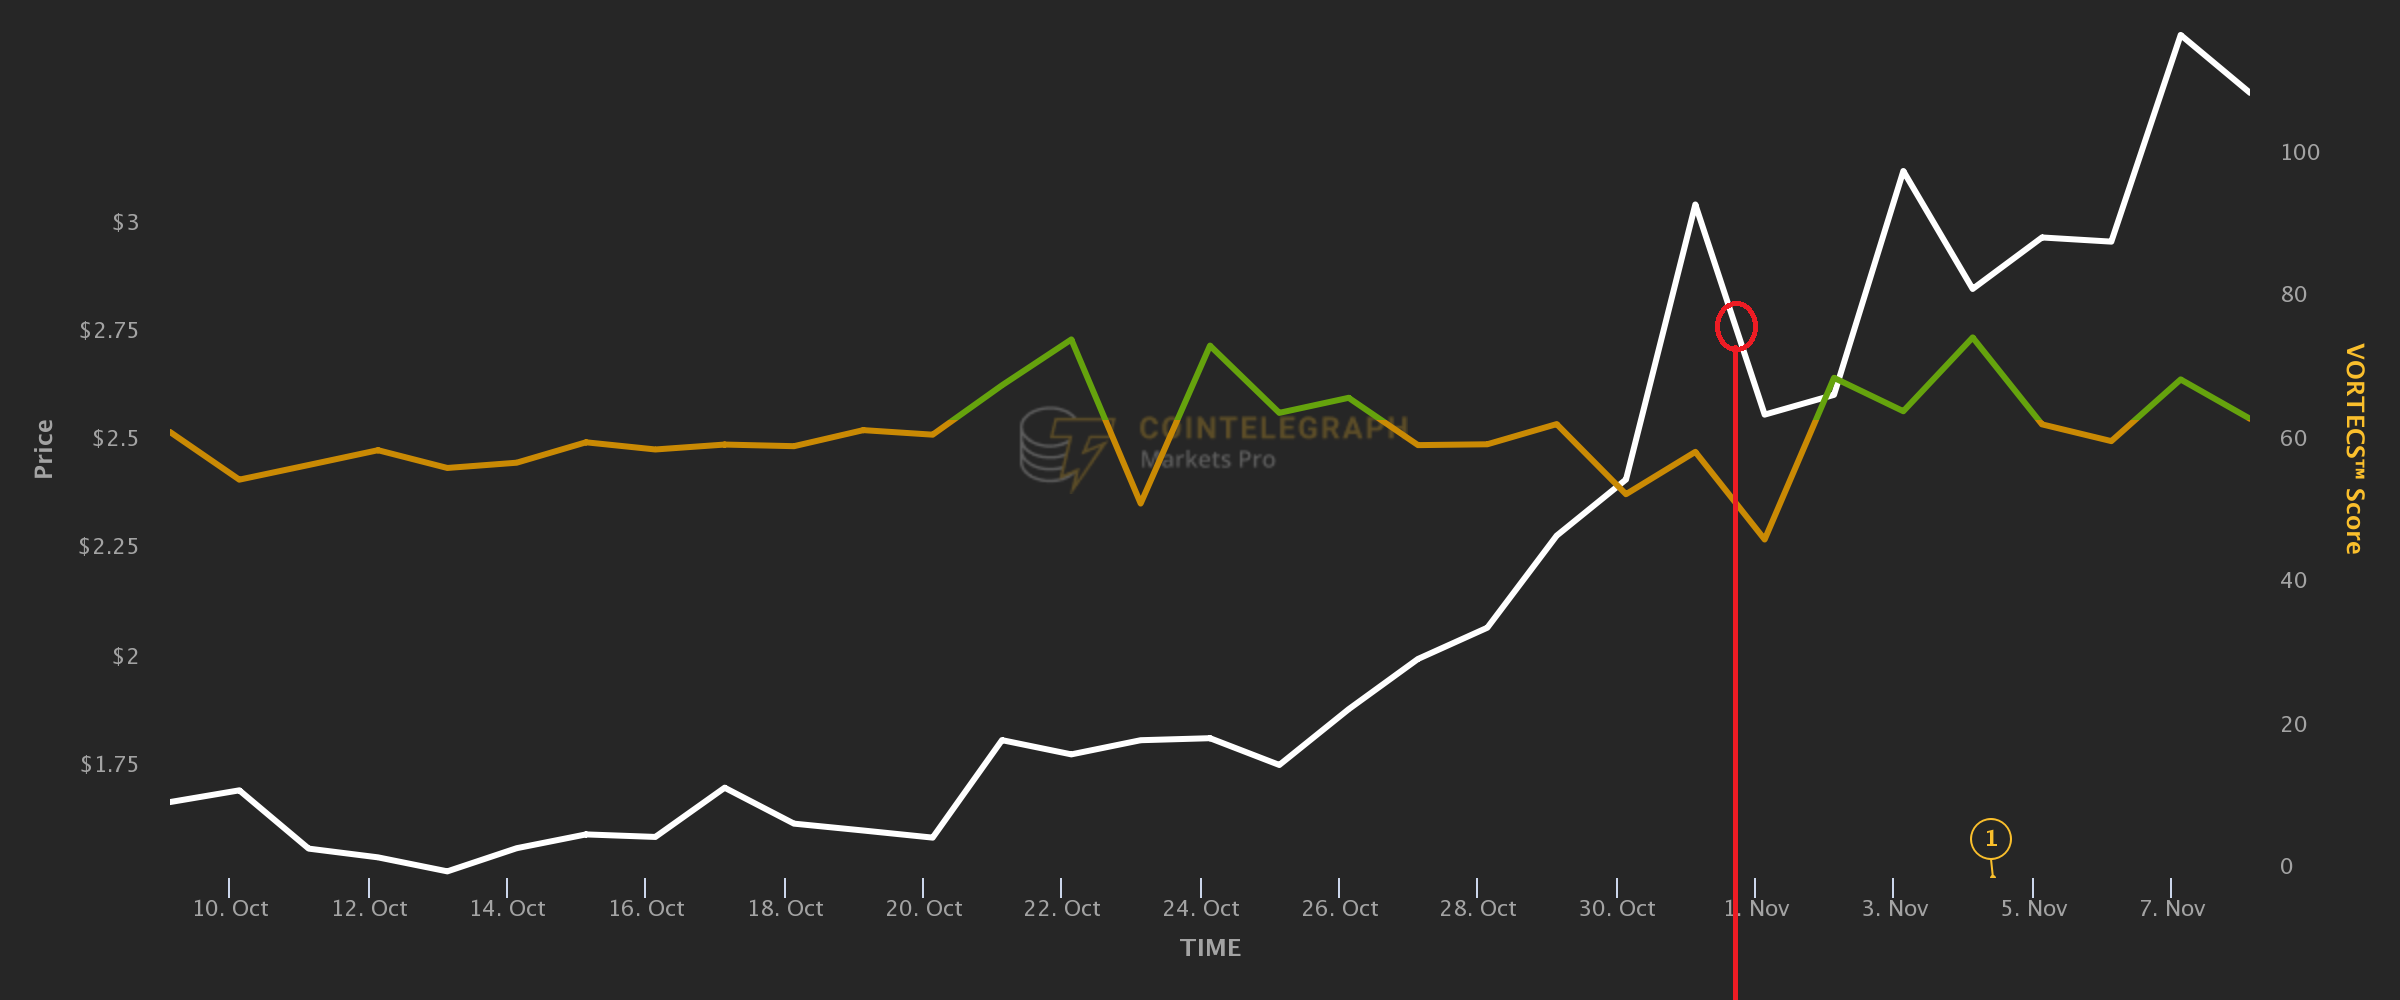
The Twitter discussion around blockchain gaming platform Enjin reached its height on Oct. 31 against a price of $2.51 as ENJ was cooling off after a parabolic rally. The onslaught of Twitter mentions foreshadowed the next leg of the action, which took the coin to the next high at $3.45.
ANKR/USD: A 329.08% surge in tweet volume backed a +39.51% monthly price change
ANKR had a massive showing around the same time as metaverse assets skyrocketed, rising from $0.081 on Oct. 28 to $0.139 a week later.
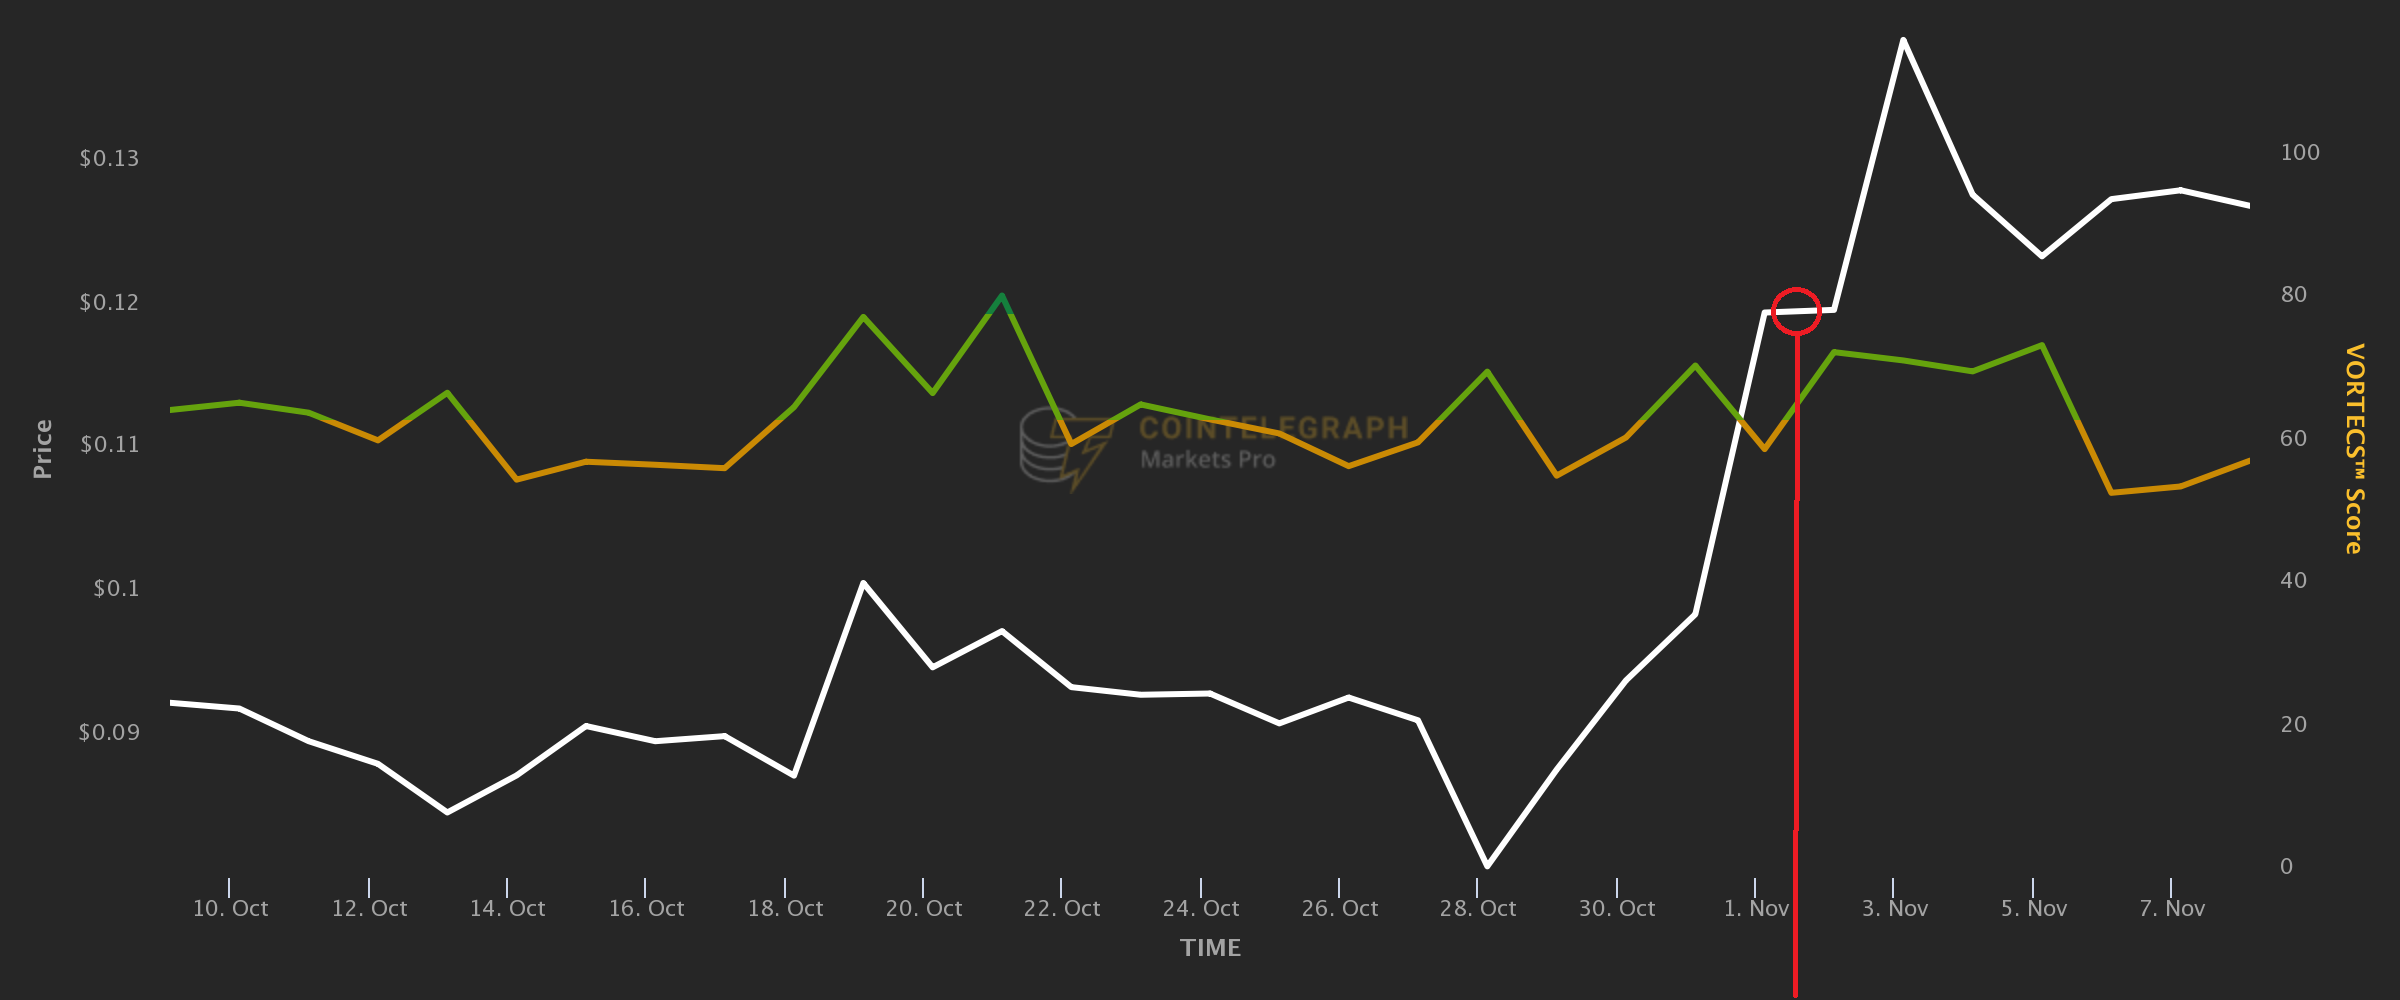
As the token’s price briefly plateaued for a breather amid the hike, the Twitter numbers went into overdrive, hitting 2,400 daily mentions. After that, the token’s price made one more leap to the monthly high registered on Nov. 3.
SAND/USD: A 328.12% increase in tweet volume was followed by a +222.12% monthly price change
The Sandbox was yet another metaverse wonder whose token price skyrocketed following the Facebook/Meta news.
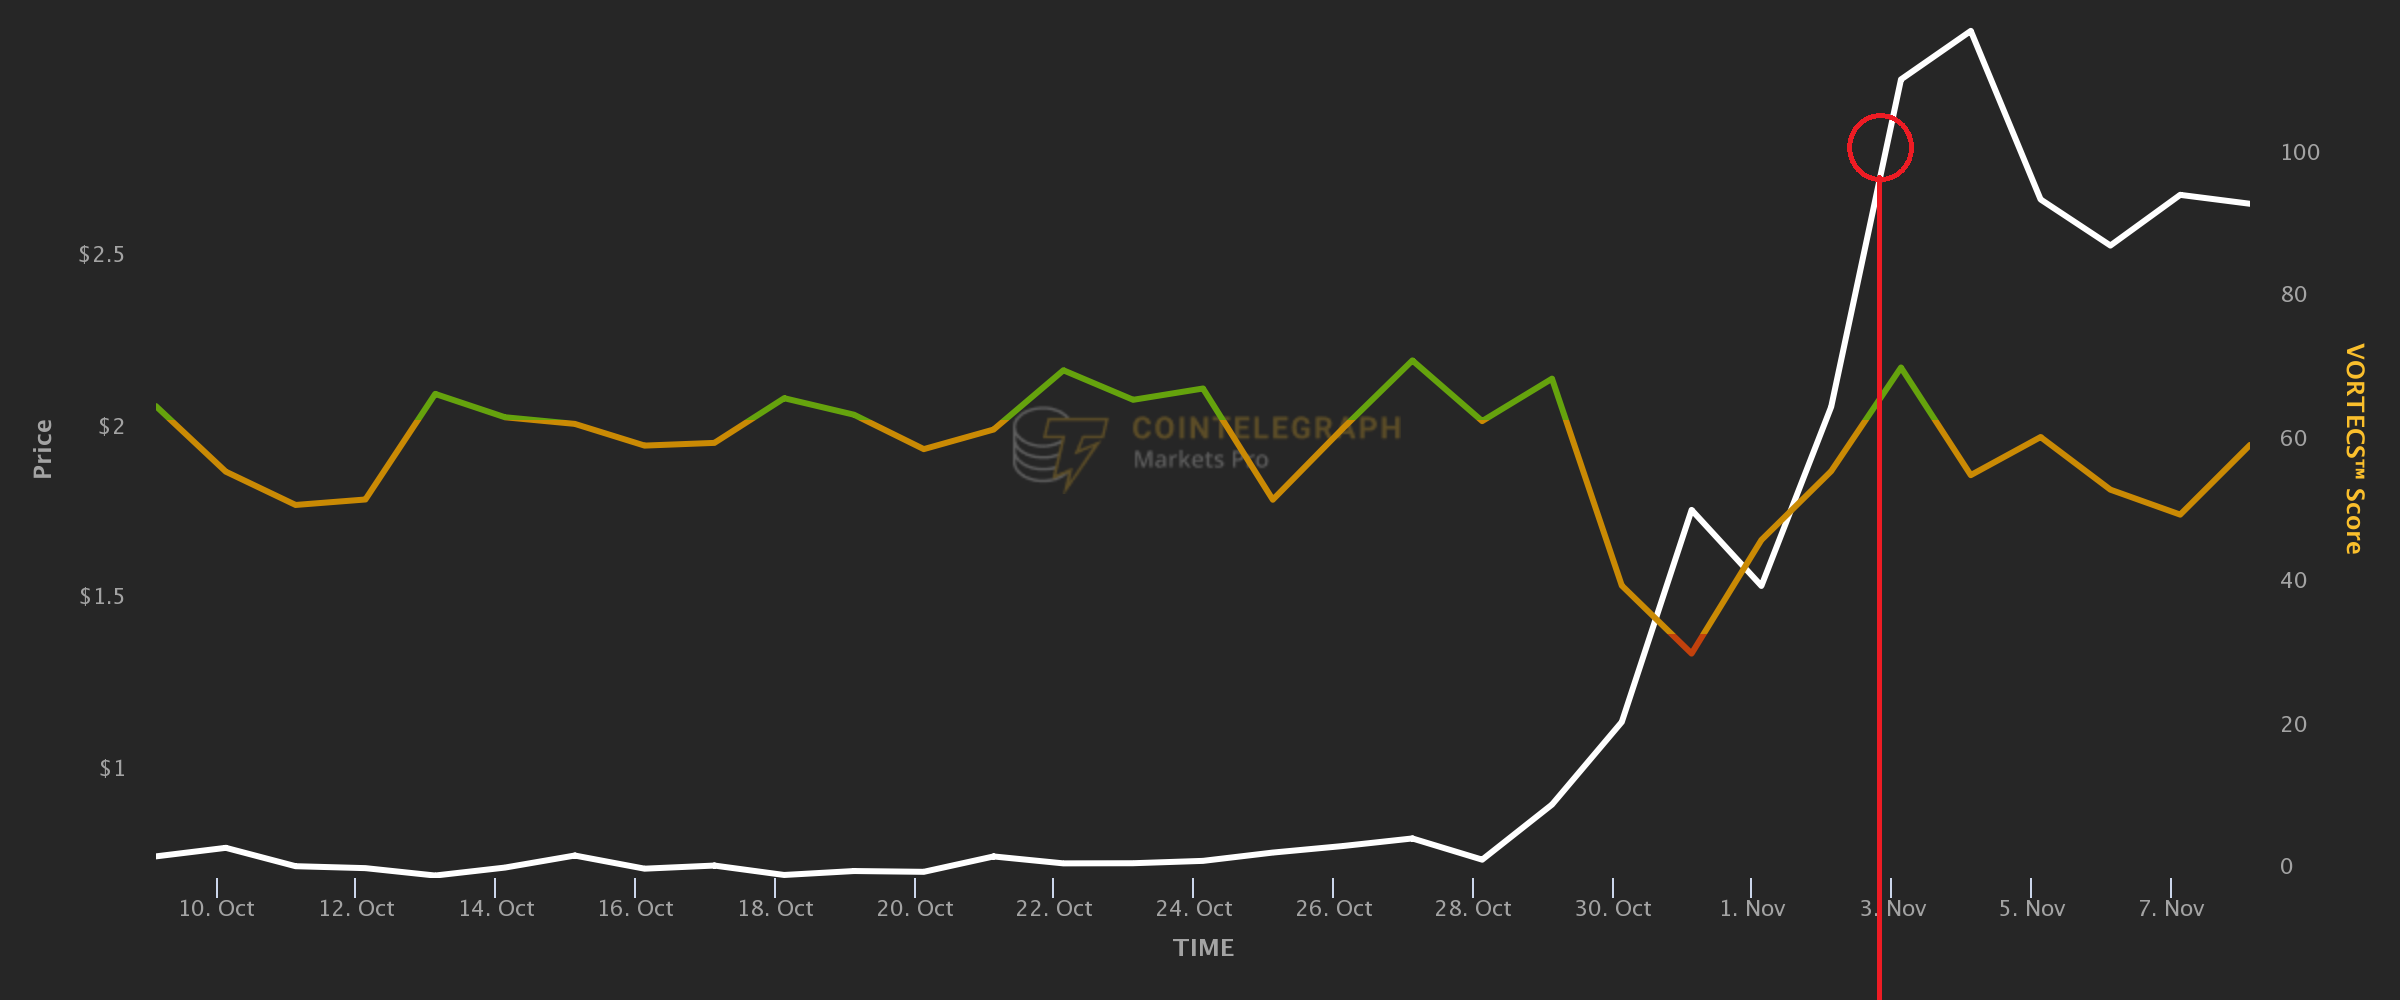
SAND’s healthy social outlook manifested when its daily tweet volume more than tripled compared with the month-to-month average, hitting a record high above 2,600 15 hours before a peak price of $3.38 was recorded.
Granted, the abnormal volume of tweets mentioning a certain asset is not in itself a recipe for an imminent price hike. Traders should delve into the actual context of what is going on around the token to render an informed decision. Yet, being alerted to massive spikes of attention to particular assets can be incredibly useful for focusing one’s analysis on the most likely candidates for a continued rally.
Cryptox is a publisher of financial information, not an investment adviser. We do not provide personalized or individualized investment advice. Cryptocurrencies are volatile investments and carry significant risk including the risk of permanent and total loss. Past performance is not indicative of future results. Figures and charts are correct at the time of writing or as otherwise specified. Live-tested strategies are not recommendations. Consult your financial advisor before making financial decisions.

