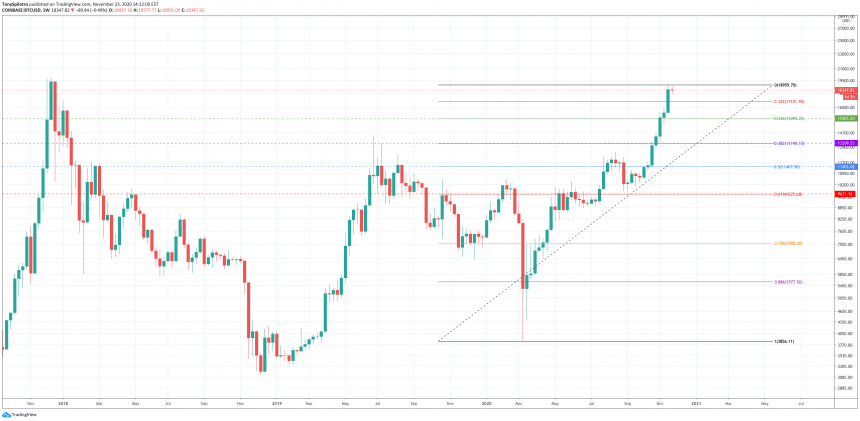
Bitcoin price broke above its 2019 high, and after that, took off another $5,000. The reason why the level was so critical to confirming a reversal back into a bull market, was due to the resistance residing at the golden ratio – based on the Fibonacci sequence.
Today, to celebrate both Fibonacci Day and Bitcoin’s breakout beyond the key zone, we’re taking a deep look at the importance of Fibonacci retracement levels in financial markets like cryptocurrencies.
What Is Fibonacci Sequence And Why How Does It Apply To BTCUSD Technical Analysis?
Although Bitcoin is an asset unlike any other before it, it still tends to follow the same laws and dynamics that govern financial markets. The cryptocurrency goes through market cycles where sentiment shifts from bullish to bearish and back, and responds the same to support and resistance as forex, stocks, commodities, and more.
The entire Bitcoin code is built on mathematical code, and everything down to the number of BTC and the block reward halving mechanism relies heavily on math.
Related Reading | Bitcoin Mathematics: Why 21 Million BTC May Have Been Chosen
It is only fitting then, that Bitcoin and other crypto assets built on math, respond so well to mathematical levels of support and resistance.
These mathematical levels tend to reside at ratios based on the Fibonacci sequence, in which the sum of the previous two numbers makes up the current number and so forth indefinitely.
On November 23rd the world celebrates the famous Italian mathematician that first made sense out of the numbers found everywhere in nature.
Leonardo Bonacci of Pisa was the author of Liber Abaci, also known as The Book of Calculation. Using the sequence, he could with a degree of accuracy predict the future population of rabbits. The numbers have since been used to predict all sorts of outcomes, and its ratios – specifically the golden ratio or divine proportion is of specific importance.
Bitcoin's 2019 rally stopped at the 0.618 level, breaking through it caused the current rally | Source: BTCUSD on TradingView.com
How Bitcoin And Altcoins React To Fibonacci Retracement Levels
In the chart above, Bitcoin’s 2019 high was the 0.618 Fibonacci retracement level – the golden ratio. Getting back above it, signaled to the market that a reversal was taking place.
Holding there last year, kept the cryptocurrency in the troughs of bear territory. The chart above also demonstrates on the way down from Bitcoin’s all-time high, each corresponding bear market peak, almost perfectly stopped at each subsequently lower Fibonacci retracement level.
Related Reading | Crypto Calculated: How Ancient Math Predicts Bitcoin’s Next Top At $270K
Each level also runs directly through some of the asset’s most critical support and resistance zones, but why? It isn’t clear why markets behave in such a way, but 0.618 often acts as the most important resistance or support level in any asset – not just Bitcoin.
The target for any bull market correction when it begins could be at the 0.618 level | Source: BTCUSD on TradingView.com
Fibonacci extensions, such as the 1.618, could act as resistance after a new all-time high is set. And with the golden ratio acting as an ideal place to buy support or sell resistance, 0.618 could be a logical place for any correction to fall to.
If Bitcoin has put in a short term top and corrects from the current prices, the 0.618 level could be the primary target. The cryptocurrency could find support at any of the Fib levels above there, but in past bull markets, it was right on the money.
Featured image from Deposit Photos, Charts from TradingView.com


