

In crypto’s fast-moving world, traders have long relied on charts, such as candlesticks, Fibonacci lines and Bollinger Bands, to interpret price action. But a quiet shift is underway.
Instead of staring at graphs or toggling between indicators, traders are increasingly turning to AI models like ChatGPT and Grok for real-time context, sentiment analysis and narrative framing. These tools don’t replace charts outright, but they’re becoming the first stop for insight, transforming how many retail and semi-professional traders approach decisions.
Here’s how and why it matters.
The crypto chart fatigue shift
Crypto charts are dense with data, but that doesn’t always translate into clarity. Reading them well requires not just technical skill but also emotional control and pattern recognition. For newer traders, charts can become overwhelming: a wall of indicators, conflicting signals or simply visual noise.
That’s where conversational AI steps in. Instead of decoding relative strength index bands or candlestick wicks, traders are now asking models questions like, “Is this a good time to buy Solana (SOL)?”
AI tools like ChatGPT and Grok offer an alternative path to insight, one that’s faster, more intuitive and less intimidating. Rather than parsing charts, users are feeding in natural-language prompts such as:
Example 1
Prompt: Summarize current sentiment on XRP using X discourse.
According to Grok, XRP (XRP) sentiment on X is mixed but cautiously bullish. It highlights optimism around regulatory catalysts and resilience while acknowledging lingering skepticism over centralization and past underperformance. The summary is well-balanced, context-rich and captures the emotional and narrative divide within the XRP community.
Example 2
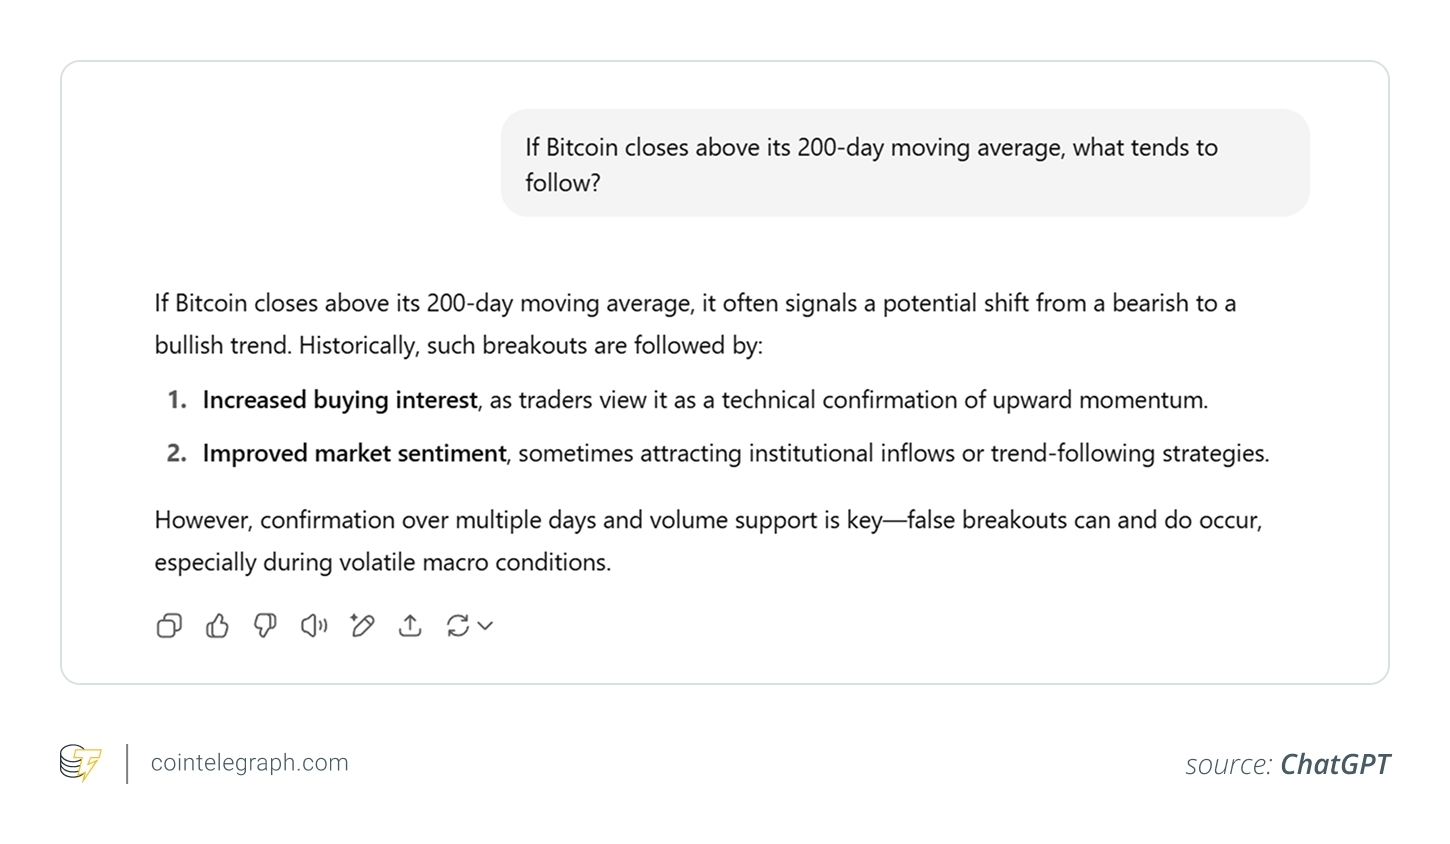
Prompt: If Bitcoin closes above its 200-day moving average, what tends to follow?
ChatGPT’s response highlights the historical implications of a 200-day moving average breakout, such as increased buying interest and improved sentiment. It also responsibly noted the risk of false breakouts. The tone is balanced, with emphasis on confirmation and context, making it suitable for both beginners and intermediate traders.
Example 3
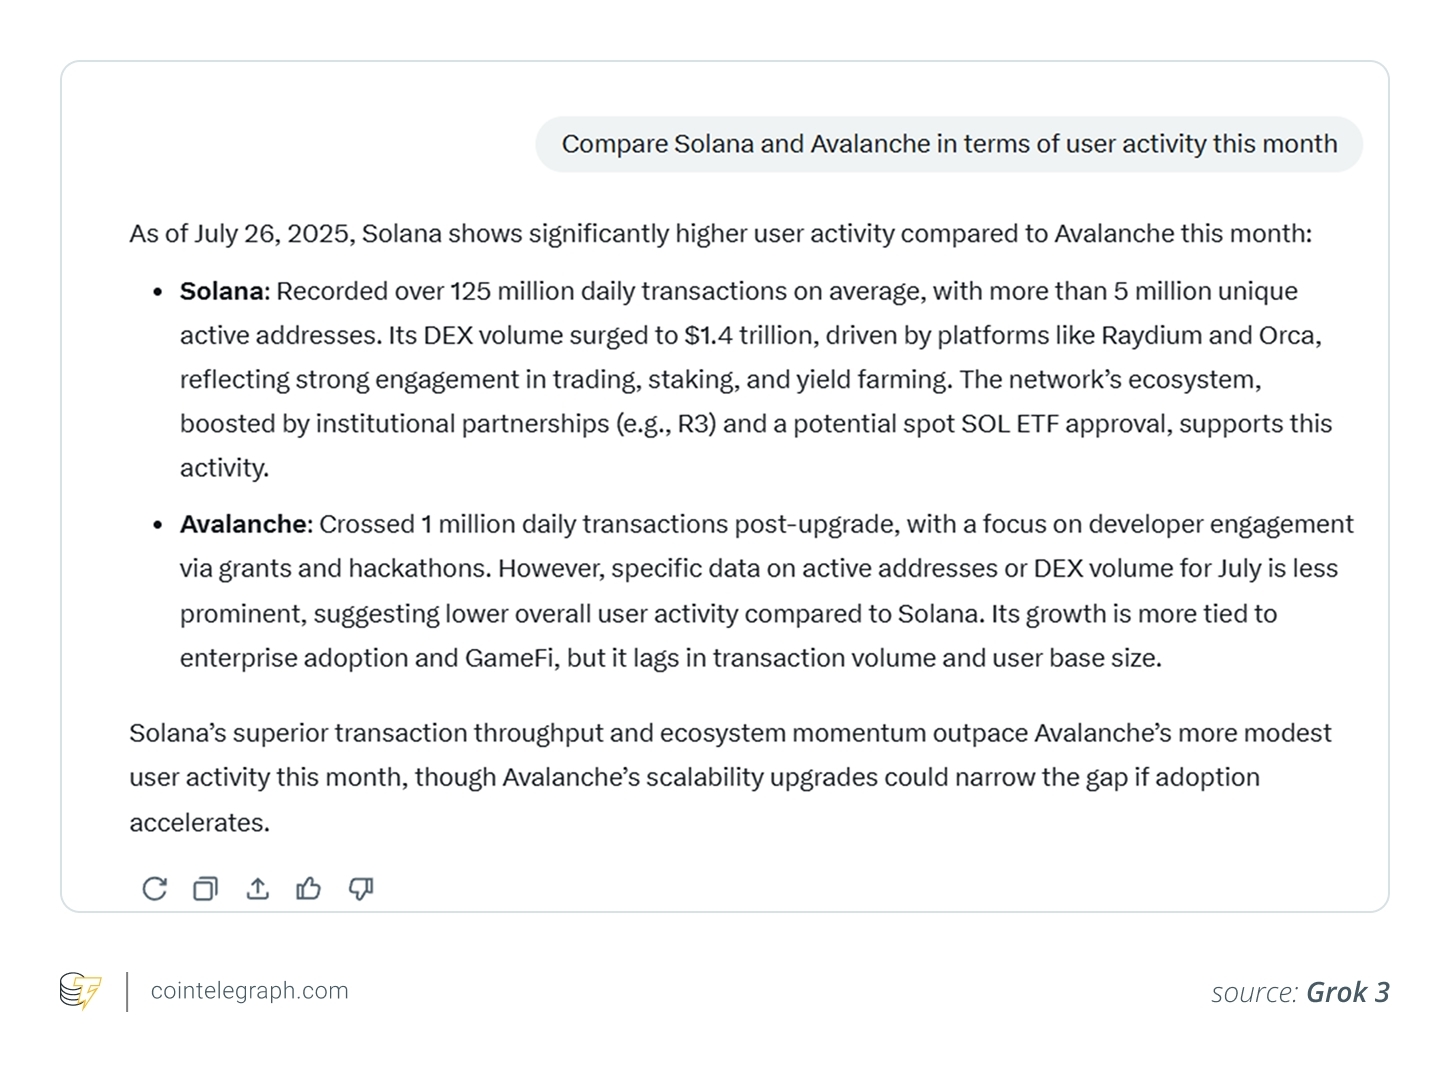
Prompt: Compare Solana and Avalanche in terms of user activity this month.
Grok’s response, as shown in the image below, provides a clear, data-backed comparison, highlighting Solana’s dominance in user activity, transaction volume and decentralized exchange engagement. It contrasts Avalanche’s growth via developer activity but notes weaker metrics. The response is concise, informative and balanced, with strong contextual framing around ecosystem drivers and institutional influence.
Did you know? ChatGPT benefits from OpenAI’s Reinforcement Learning with Human Feedback (RLHF), fine-tuned for safe, instructive dialogue.
ChatGPT vs. Grok: Who’s more “trader-friendly?”
ChatGPT is ideal for breaking down technical indicators, comparing token fundamentals and simulating trading scenarios. It integrates well with TradingView via plug-ins or API for those who still want some visual analysis.
Grok, tightly integrated with X, is ideal for real-time sentiment and meme-aware cultural signals. It’s better suited for catching fast-moving narratives or early alpha from the crypto community.
To explore how these models interpret the same input differently, the following two prompts were fed into both GPT-4o (ChatGPT) and Grok (via X):
Example prompt 1
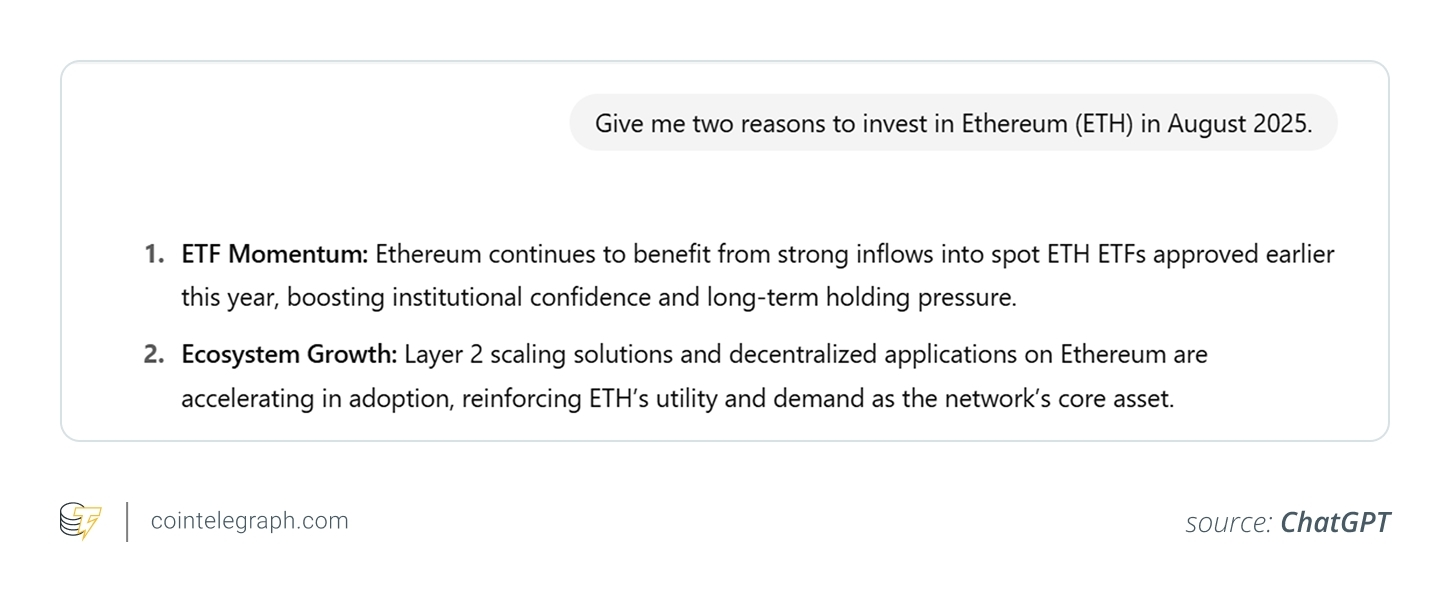
Prompt: Give me two reasons to invest in Ethereum (ETH) in August 2025.
ChatGPT output:
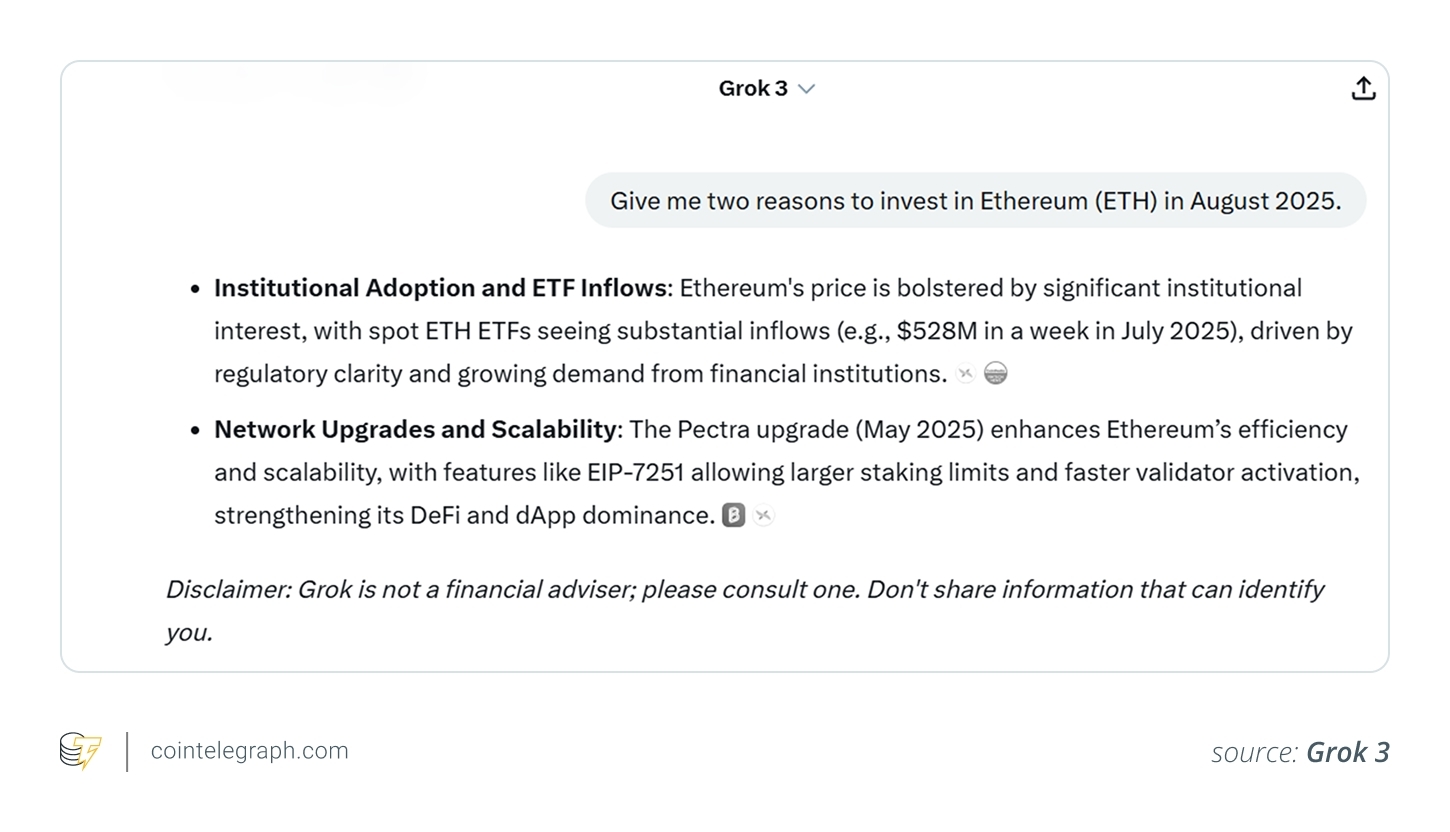
Grok 3 output:
As observed above, ChatGPT’s response provides a broader and more accessible rationale. It focuses on exchange-traded fund (ETF) momentum and ecosystem growth through layer-2 solutions and decentralized applications, concepts that are easier to grasp for newer investors. This response takes a big-picture view and highlights Ether’s (ETH) expanding utility and adoption. However, it lacks the specificity and numerical support found in the Grok response, which may make it feel less grounded or convincing for those seeking hard data or detailed developments.
Grok 3’s response offers a more data-driven and technically detailed justification for investing in Ether in August 2025. It highlights significant institutional interest by citing a specific ETF inflow figure ($528 million in July 2025), which lends credibility and a sense of urgency.
Additionally, it references the Pectra upgrade and Ethereum Improvement Proposal 7251, which are specific improvements tied to Ethereum’s scalability and validator efficiency. This caters well to technically literate investors or those seeking precise, up-to-date insights. However, the technical language might overwhelm general audiences or casual investors unfamiliar with Ethereum’s internal mechanics.
Example prompt 2
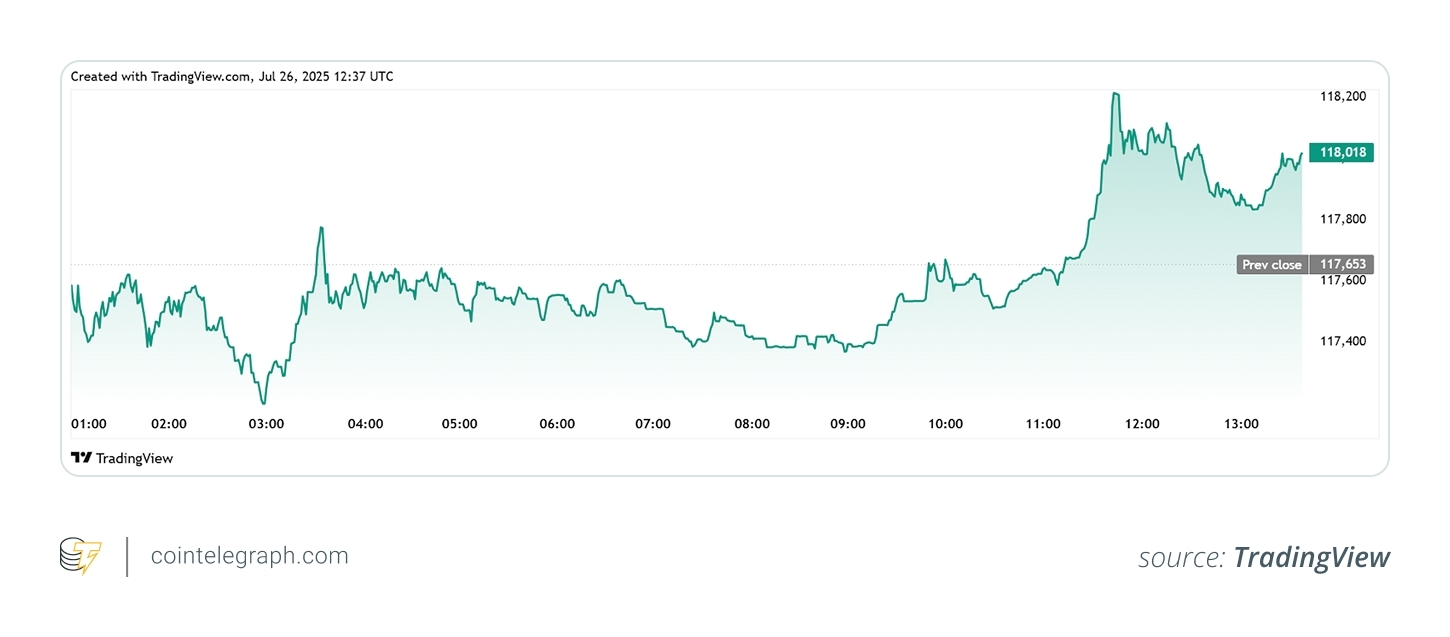
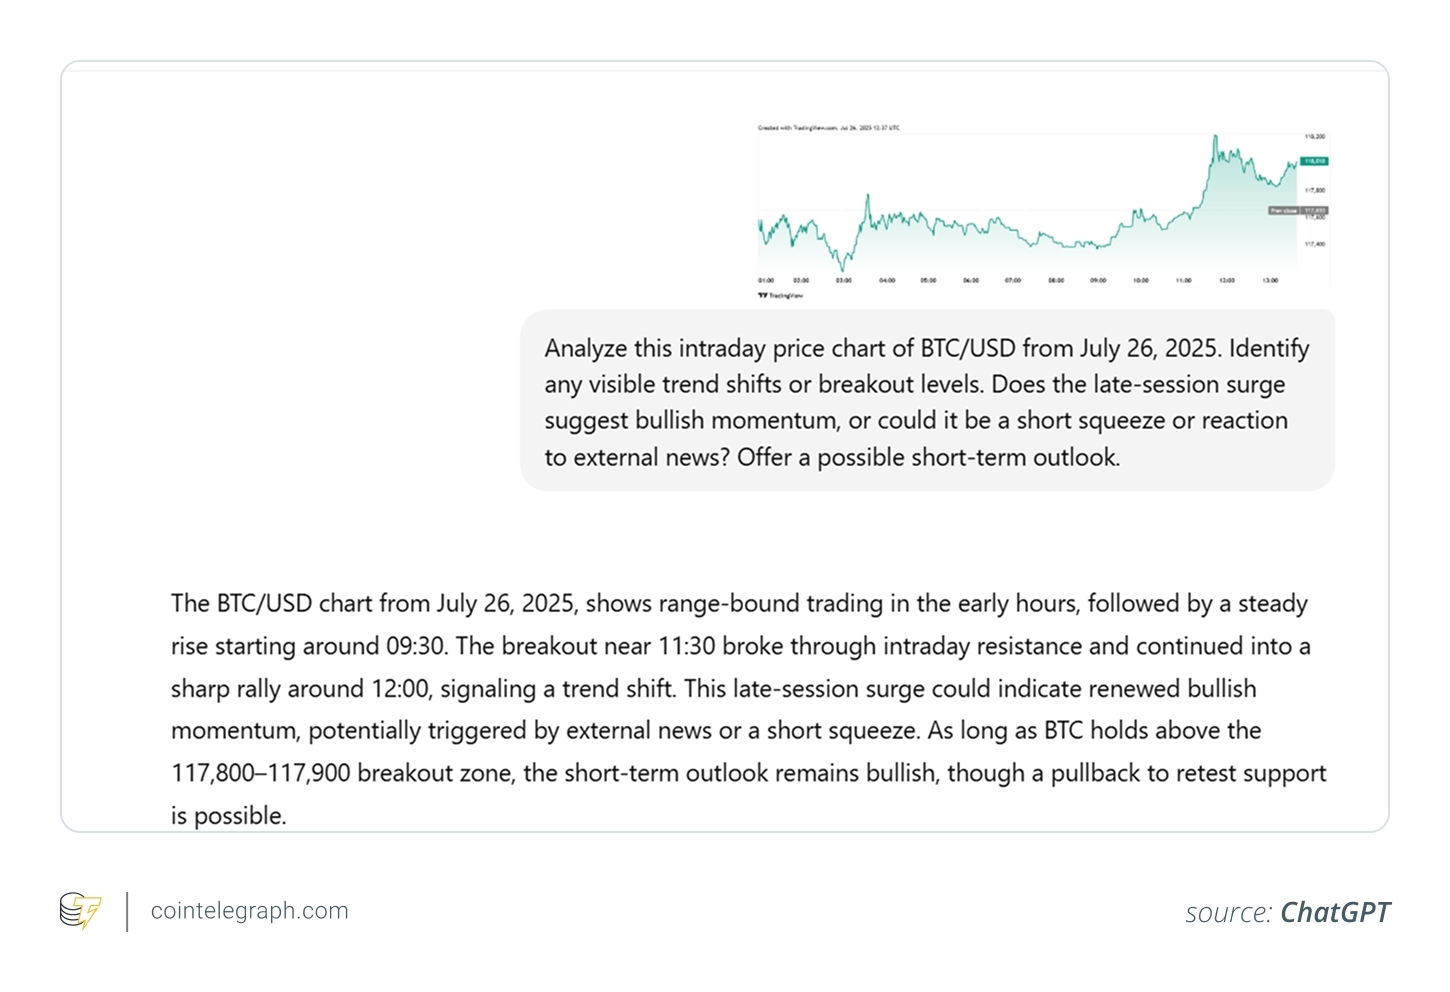
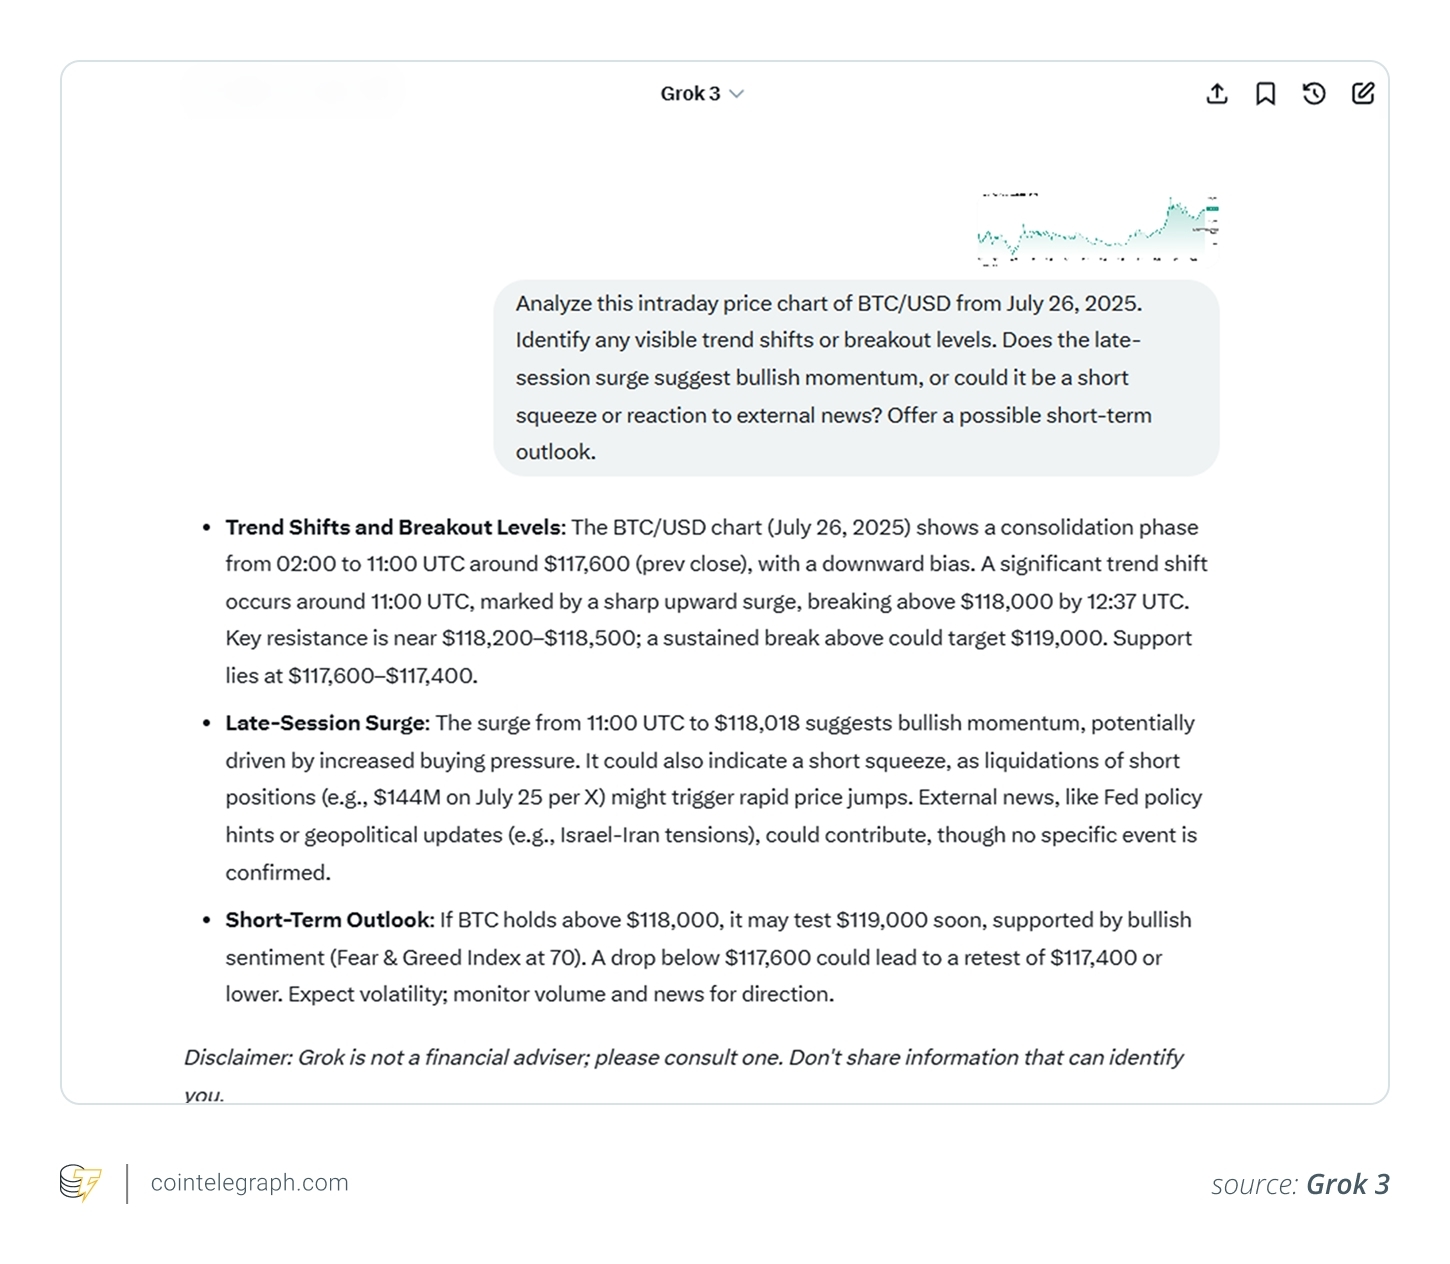
Prompt: Analyze this intraday price chart of BTC/USD from July 26, 2025. Identify any visible trend shifts or breakout levels. Does the late-session surge suggest bullish momentum, or could it be a short squeeze or reaction to external news? Offer a possible short-term outlook.
ChatGPT output:
Grok 3’s output:
As observed, ChatGPT’s analysis is more fluid and narrative-based. It mentions range-bound trading early on, with a breakout around 11:30 UTC and a rally near 12:00, identifying the move as a trend shift. The potential causes, external news or a short squeeze, are similar to Grok 3’s explanation. While the support/resistance levels are less precise ($117,800-$117,900), it concludes with a cautiously bullish outlook, flagging a pullback as possible. It’s easier to follow but slightly less detailed in technical precision.
On the contrary, Grok 3’s analysis offers a more segmented and data-rich explanation. It breaks down the chart into key sections: trend shifts, surge cause and short-term outlook. The response notes a clear shift around 11:00 UTC, with a breakout above $118,000, supported by a possible $144-million liquidation event and external triggers like geopolitical tensions. The response also identifies resistance ($118,200-$118,500) and support ($117,600-$117,400) zones and interprets the late-session rally as potentially bullish if Bitcoin (BTC) holds key levels. This structured, technical breakdown helps traders focus on key decision points.
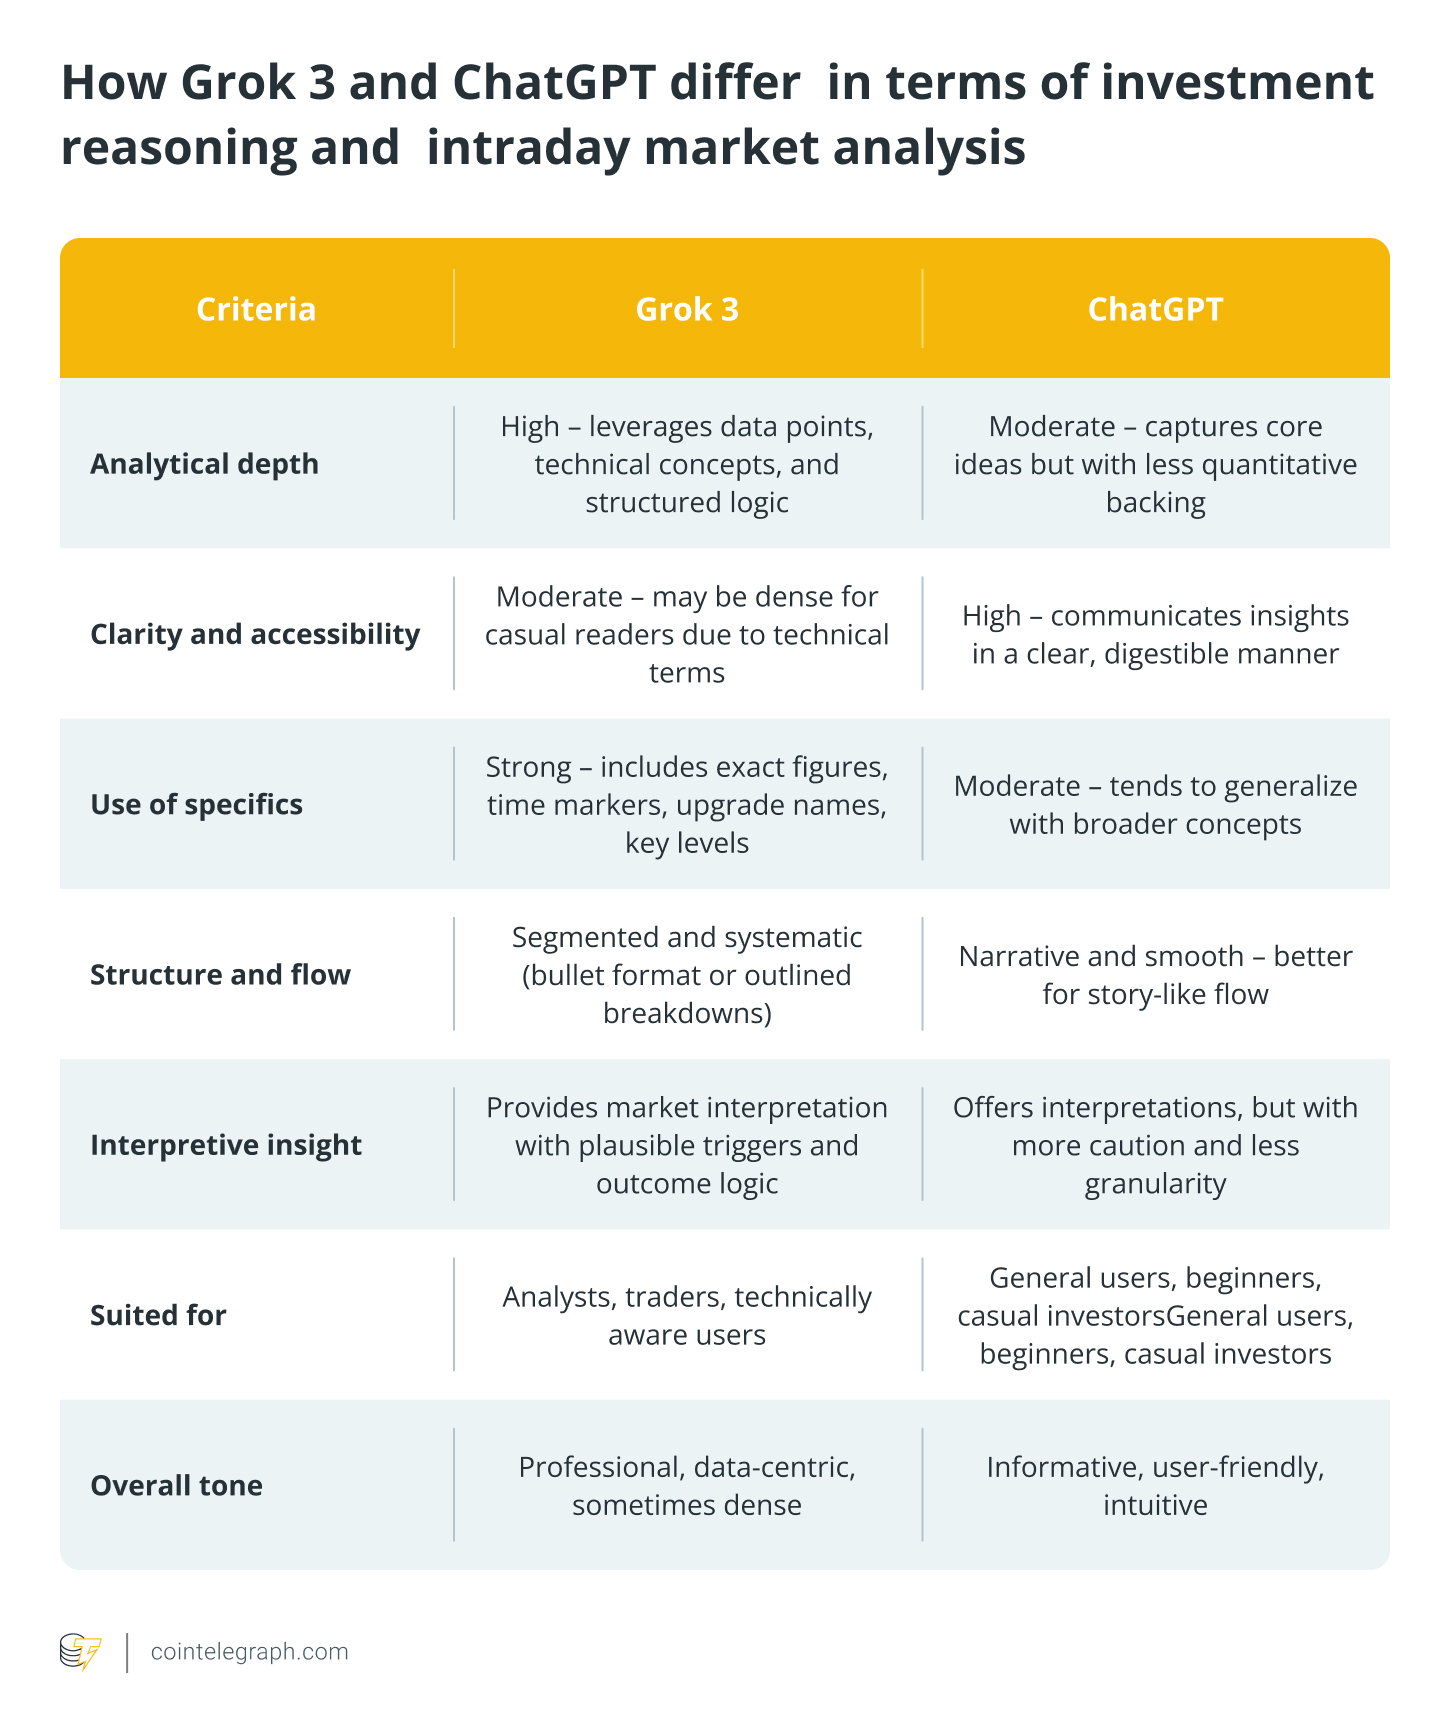
Based on two comparative experiments, one focused on investment reasoning and the other on intraday market analysis, here is a summary table outlining the strengths and weaknesses of Grok 3 and ChatGPT-4o.
So, ChatGPT is your analyst, but Grok is your trader friend who never sleeps and always has X open.
Notably, if other models (like Gemini or Claude) were used, the outputs would likely vary in tone, depth and real-time relevance, depending on the model’s access to current data, reasoning style and domain alignment.
The key takeaway? Different AIs serve different trading needs. For fundamentals and structured logic, GPT-4o is a reliable analyst. For sentiment and speed, Grok is your plugged-in, socially attuned trading companion.
Did you know? Grok 3 is trained on real-time X data, giving it a native edge in capturing fast-moving sentiment shifts and cultural language others often miss.
Will AI replace charts entirely?
Not quite. Charts remain a foundational tool for tactical execution, especially for day traders, swing traders and quant systems that rely on real-time volume, indicators and price structure.
But AI is beginning to take over the cognitive layer of trading: the “why” behind the “what.”
Where charts show what is happening, models like ChatGPT and Grok help explain why it’s happening, digesting macro news, onchain flows, community sentiment and historical context within seconds. They’re increasingly used for narrative framing, scenario simulation and filtering signals from noise — roles charts were never designed to fill.
So, while candlesticks won’t disappear, they’re no longer the sole source of insight. More often, traders now turn to AI first for clarity, direction and speed before confirming with the chart.
From charts to chatbots: How AI is becoming the first stop for crypto traders
If you’ve recently asked an AI model about a coin before opening a chart, you’re not alone. The move from visual to conversational analysis is already underway, especially among part-time traders and mobile-first users who prefer direct answers over dashboards.
Charts aren’t going away. But their role is changing. They’re no longer always the starting point, just the next layer.
In a space where speed matters but clarity is king, AI is becoming the first place traders go to ask:
-
What’s driving this move?
-
What happened last time?
-
What should I watch next?
Because sometimes, the smartest chart… is the one that talks back.
Why AI isn’t a substitute for your strategy
While AI models offer speed and clarity, they aren’t infallible. Their outputs depend heavily on training data, recent content and prompt quality. They don’t “see” live order books or price movement in real time and may miss nuance in complex macro events.
Overreliance can lead to false confidence, especially if used without cross-checking with charts or news. Traders should treat AI as a thinking assistant, not a trading oracle.
Just as charts can mislead without context, so can AI without verification. The best insights come when human judgment and machine reasoning work together, not in isolation.
This article does not contain investment advice or recommendations. Every investment and trading move involves risk, and readers should conduct their own research when making a decision.


