A string of back-to-back upside rejections at a local top is putting Ethereum at risk of correcting lower towards $350.
Looking at ETH/USD 1H chart shows the pair attempting to close above $384, a resistance target that had held through extreme bullish biases in the past. It continues to defend bears as Ethereum traders repeatedly fail to push the prices above, leading to the formation of multiple lengthy wicks to the upside.
ETHUSD trades near the interim resistance area of $384-390. Source: TradingView.com
Technically, they represent rejected spikes–even hardcore attempts to take ETHUSD above $384 meet with equally strong selling pressure.
That leaves traders with the option to either keep testing the level for a breakout move while gathering more accumulators at the local support level ($375) or give up the area altogether to find serious buyers at further lower levels.
Breakout Scenario
As shown in the chart above, Ethereum is technically trading inside an Ascending Triangle. A horizontal line/area in purple coupled with a rising trendline with more than two higher lows attests to the technical pattern.
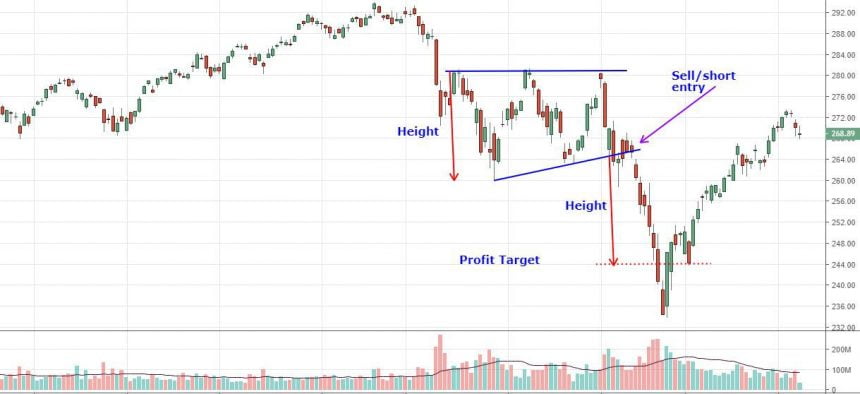
An Ascending Triangle is a continuation signal, which means that traders expect it to push the price in the direction of its previous trend. Once the breakout occurs, they open buy or sell positions depending on the direction of the price move. The length of the breakout, meanwhile, is typically the same as the maximum height of the Triangle.

Example of Ascending Triangle breakout in a downtrend. Source: Investopedia
Ethereum has more probability of breaking to the downside, given the trend before the Ascending Triangle formation was bearish. Should that happen, the cryptocurrency will pull back after failing to break above the $384-390 resistance area to retest the rising trendline (green) as support.
That price floor currently sits near $350, a psychological level for the next potential rebound.
Nevertheless, a negative breakout will occur if the Ethereum price breaks below the green trendline. That would mean an extended downside move – of about $67 based on the maximum height of the Triangle. All and all, ETH/USD risks falling to $283 if the bearish pattern holds valid.
Ethereum Bullish Scenario
Conversely, if Ethereum manages to break above the $384-390 range, then it would eye an extended upside momentum towards $450 or above. That would also mark a trend reversal. It means ETH/USD could pursue further upside targets by flipping $384-390 from a resistance area to support.
“Ethereum is essentially trapped in between two important Quarterly levels $360 and $391,” said an analyst. “Its Quarterly candle closes in less than two weeks. A close above $360 could be enough to preserve ETH’s bullish momentum and avoid the further downside.”
ETH/USD was up 4.45 percent ahead of the New York trading session Thursday.


