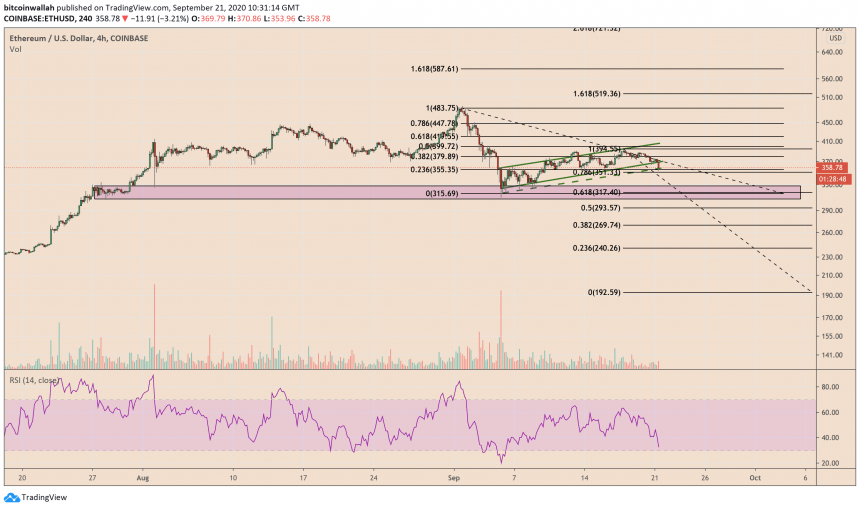
Ethereum is looking to fall towards $200 after breaking a multi-week support level this Monday.
The price floor was a part of a Bear Flag pattern. In retrospect, Bear Flag appears as an asset consolidates in an upward channel following a robust directional move down. The price eventually breaks below the Channel’s lower trendline, a move that signals extension/continuation to the existing bearish bias.
ETH/USD broke below its Bear Flag support on Monday. The pair suffered two days of selling sentiment, falling more than 6 percent as traders failed to break above a crucial technical resistance level of $375.
Ethereum breaks out of a Bear Flag pattern to signal further downside moves. Source: TradingView.com
ETH/USD is now testing the intermediary downside target (dashed green; $350) of the same Bear Flag for a sharp pullback. It, nevertheless, risked breaking further to the downside, with immediate short targets lurking insides the $323-310 range.
The entire bottom area between $310 and $350 served as an accumulation range for traders, according to Ethereum’s recent price behaviors. The purple bar in the chart above shows ETH/USD undergoing sharp rebounds.
While the potential of a bullish retracement was high, Ethereum still risked plunging to as low as $200 based on the technical description of a Bear Flag breakdown.
Why $200?
After price breaks below Flag, traders measure the short target by first measuring the distance of the initial decline, i.e., the height of the Flagpole. In the current scenario, the total length of the Flagpole is $178.
At the point of breakdown, which is near $370, traders can use the $178 flagpole to establish a potential price target at $370-$178=$192.
Potential reversal levels as ETH/USD eyes $192. Source: TradingView.com
With $192 in view, an overstretched move towards the said target could have traders eye a string of Fibonacci retracement levels. The first in the queue is $315, a support level that should allow traders to accumulate and open a long position towards the $351-355 area.
A break below $315 could have traders open a short towards $293 while maintaining extended price targets at $269, 240, and 192.
Meanwhile, a strong bounce back from $350 or $317 could invalidate the Bear Flag overall. Instead, traders would then eye close above $379, $399, and succeeding Fib levels above.
Ethereum Fundamentals
ETH/USD is trading 175 higher on a year-to-date timeframe. Therefore, the pair’s currency downtrend can also be a part of a corrective move. Traders are offloading their medium-term holdings to secure profits. That allows them to repurchase the token again when it hits accumulation-worthy price levels, as discussed above.
Nevertheless, Ethereum’s fall this week also appears in the wake of a massive bearish correction in the decentralized finance sector. As a blockchain project, Ethereum powers some of the leading DeFi projects. Meanwhile, its native token ETH is a part of many yield-generating liquidity pools.
The overblow DeFi sector has also caused a major increase in the fees of the Ethereum network, its second-highest level ($11.61) after setting a record earlier in September ($14.58). That has pushed miners to attract more hash power.
That further creates downside pressure on the Ethereum’s price as miners sell their ETH to buy more electricity.


