
Analysis
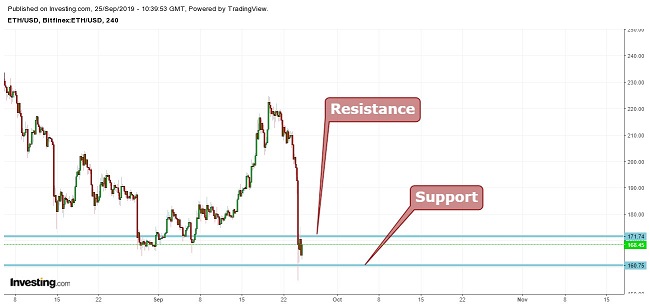
When looking at the chart below, we can see that Ethereum (ETH)trade is currently trading at $166.67. The ETH price has recently broken the support of $171.25 turning it into resistance with the next support level at $160.75.
The second-largest cryptocurrency’s price has fallen 26% which clearly indicates a negative momentum. The price has jumped back up after breaking the support, but the jump looks temporary and the price may again test the support.
Dow Theory
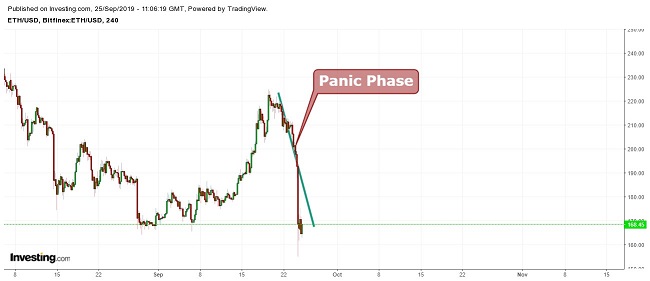
According to Dow Theory, Ethereum’s price is in the panic phase. In this phase, distressed selling is seen from those who believe that the worst is yet to come or are forced to liquidate. This phase is followed by the accumulation phase where informed investors start to take long positions.
Bollinger Bands
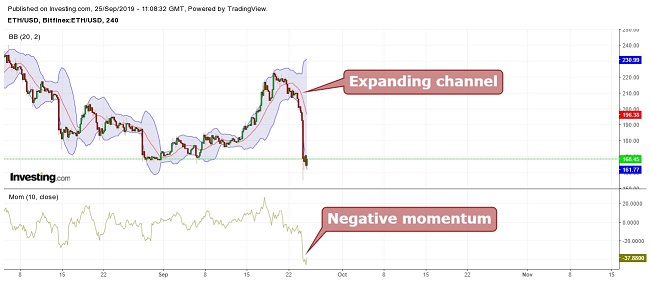
The cryptocurrency price is moving between the channels with the lower channel limit acting as support and the middle average line acting as resistance.

It can be seen that the channel is expanding with the negative momentum. This indicates an increased volatility with negative sentiments, so the ETH price may fall further until it closes above the middle average line.
Moving Average
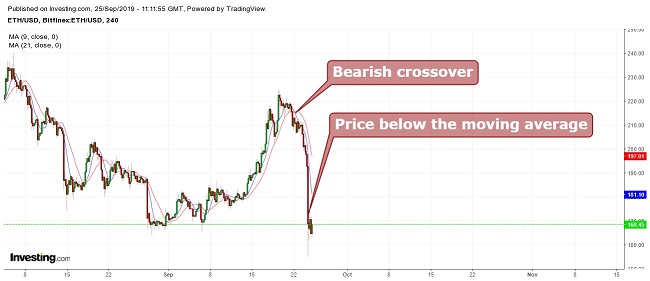
When taking 9 period moving averages (blue) with 21 period moving averages (red), a bearish crossover is seen, with the price moving below the 9 and 21 period moving averages. This is an indication of further correction. It is suggested to wait till the ETH price closes above the moving averages.
Conclusion
We see that Ethereum (ETH)trade is currently trading at 166.67; the resistance is at $171.25; and support at $160.75. Looking at the chart and technical indicators it is suggested not to take long positions at this price range.
It is advised to take long positions only if price closes above the resistance with relatively high volume. Swing trading can also be done keeping the target price at $171 and a stop-loss at $167. A close above $171 can take the price to $187 and a close below $160 can drag the price all the way down to $146.
Pivot Points
| Name | S3 | S2 | S1 | Pivot Points | R1 | R2 | R3 |
| Classic | 154.81 | 170.63 | 193.09 | 208.91 | 231.37 | 247.19 | 269.65 |
| Fibonacci | 170.63 | 185.25 | 194.29 | 208.91 | 223.53 | 232.57 | 247.19 |
| Camarilla | 205.03 | 208.54 | 212.05 | 208.91 | 219.07 | 222.58 | 226.09 |
| Woodie’s | 158.13 | 172.29 | 196.41 | 210.57 | 234.69 | 248.85 | 272.97 |
Technical Indicators
| Name | Value | Action |
| RSI(14) | 42.681 | Sell |
| STOCH(9,6) | 26.601 | Sell |
| STOCHRSI(14) | 3.888 | Oversold |
| MACD(12,26) | -2.770 | Sell |
| ADX(14) | 34.451 | Buy |
| Williams %R | -93.420 | Oversold |
| CCI(14) | -83.2111 | Sell |
| ATR(14) | 42.1927 | Less Volatility |
| Highs/Lows(14) | -31.6927 | Sell |
| Ultimate Oscillator | 43.488 | Sell |
| ROC | -45.804 | Sell |
| Bull/Bear Power(13) | -29.6420 | Sell |