The price of Ethereum (ETH) showed so much strength but has been hit with resistance against Tether (USDT) as the Ethereum merge is announced.
Ethereum price rallied with so much strength from a region of $1,670 to $1,924, as bulls anticipate the Ethereum merge from proof-of-work (POW) to proof-of-stake (POS).
Ethereum merge is an upgrade on the Ethereum network from POW to POS so as to increase its network efficiency in transactions. (Data feeds from Binance)
Ethereum Price Analysis On The Weekly Chart
From the chart, the price of ETH saw a weekly low of around $900, which bounced from that area and rallied to a price of $1,920, this is an over 100% rise in price.
The price has built more momentum as it faces resistance at $1,920.
If the price of ETH on the weekly chart continues with this bullish structure, it could quickly revisit $1,900 and trend higher to $2,400.
Weekly resistance for the price of ETH – $1,920.
Weekly support for the price of ETH – $1,012.
Price Analysis Of ETH On The Daily (1D) Chart

The price of ETH found strong support at around $1,580, with what seems to be an area of interest on the daily chart.
ETH bounced from its support and rallied as it faces resistance to break above a ranging channel and has continued to move in range.
With bulls placing more buy bids this channel was broken pushing ETH price to $1,920.
At the point of writing, the price of ETH is at $1,888, above the 50 Exponential Moving Average (EMA) with a price of $1,580.
ETH is faced with a price rejection from the $1,920 region, as this has proven to be a resistance preventing the price to trend higher.
If ETH price breaks this resistance of $1,920 successfully we could see the price trending higher ahead of the merge. If the ETH price gets rejected, $1,580 which corresponds with 50 EMA will be good support for buys.
The Relative Strength Index (RSI) for the price of ETH on the daily chart is above 65, indicating healthy buy bids for ETH.
The volume for ETH indicates buy bids, this shows bulls would want to push the price higher.
Daily (1D) resistance for ETH price – $1,920.
Daily (1D) support for ETH price – $1,580.
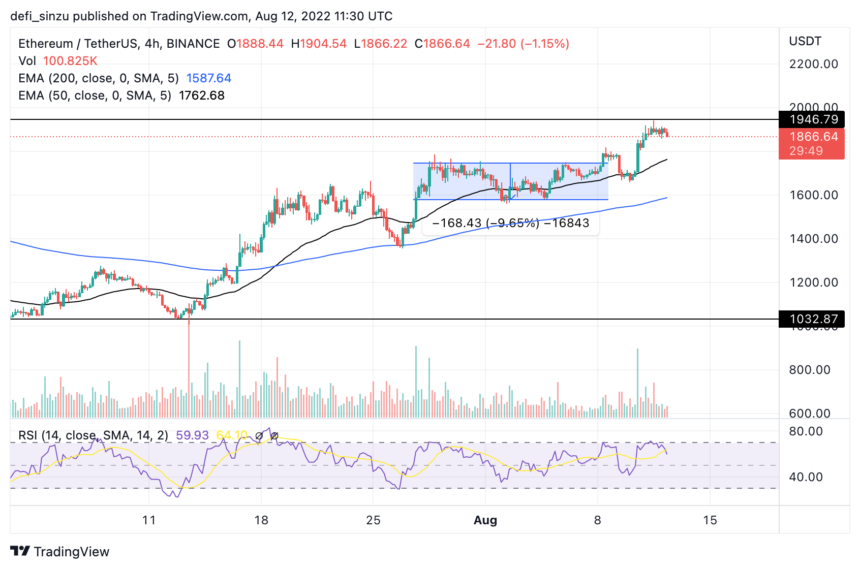
Price Analysis OF ETH On The Four-Hourly (4H) Chart

The price of ETH has continued to maintain its bullish structure despite facing resistance at $1,920 trying to break out and trend higher.
ETH is trading above the 50 and 200 EMA with prices of $1,760 and $1,580 acting as its support on the 4H chart, as the price faces resistance at $1,920.
If the price of ETH breaks above the resistance with the good volume we could see the price trending to $$2,400, In case ETH is unable to break and experience a sell-off, 50 and 200 EMA prices would act as support for ETH prices.
Four-Hourly (4H) resistance for ETH price – $1,920.
Four-Hourly (4H) support for ETH price – $1,760, $1,580.
Featured image from Watcher Guru, Charts from TradingView.com


