Bitcoin’s (BTC) price action continues to be less than impressive unless one is a bear capitalizing on the current shorting opportunities.
Bulls pinned their hopes on BTC price breaking out of the falling wedge in a strong upside move since the consensus was that this particular pattern tends to produce bullish outcomes more often than not. This was not the case and Bitcoin price toppled below the descending trendline to $7,981.
Since reaching a dominance rate of 69.35% on Oct. 27, Bitcoin’s dominance rate has dropped to 65.9% and a growing number of traders appear to be shifting their attention to altcoins as many are pressing against their long-term descending trendlines and 200-day moving averages.
Crypto market data monthly view. Source: Coin360
Ultimately, the issue here seems to be a lack of interest manifesting in low trading volume.
Some crypto-Twitter analysts are now calling for Bitcoin price to drop to $6,000 and the most bearish among them have called for a revisit to the $3,000 range. Bitcoin’s current price action does not suggest a drop below $6,000 as a realistic short-term price estimate. But let’s have a look at the charts to see what clues they could provide.
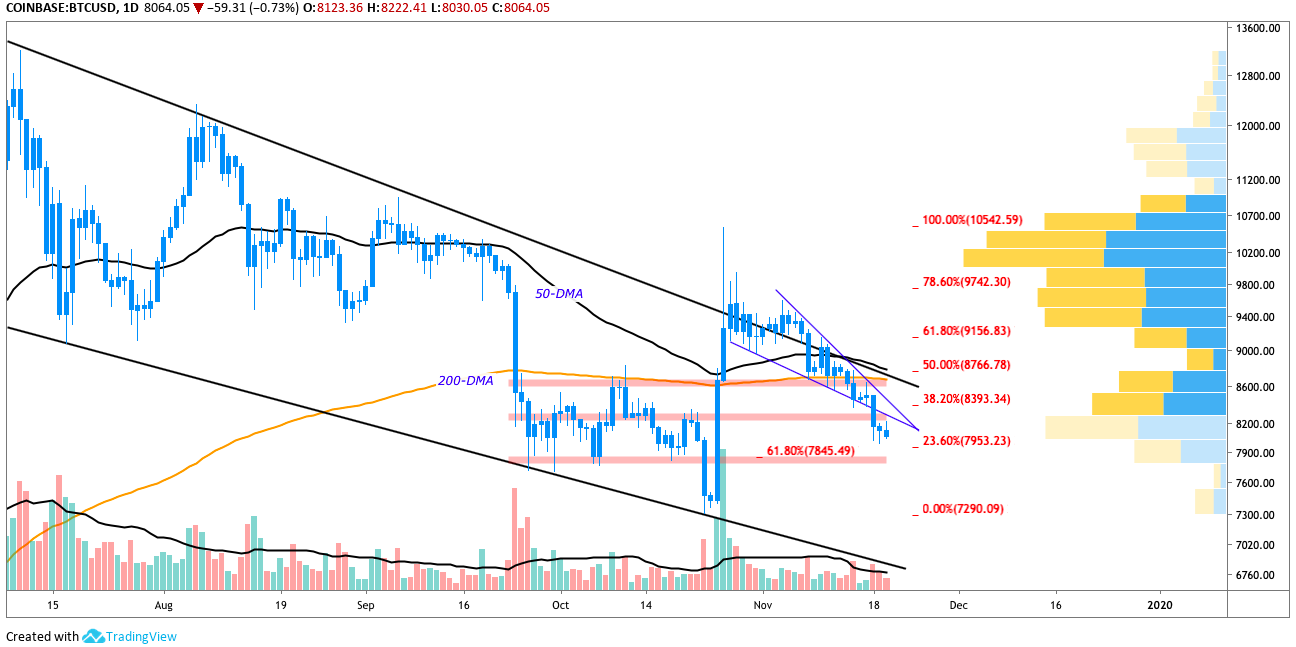
BTC USD daily chart. Source: TradingView
Bitcoin’s nearest support below $8,000 is at $7,866, roughly $20 away from a golden pocket bounce off the 61.8% Fibonacci retracement level at $7,845. Currently, the $8,300 support has flipped to resistance, a point which also aligns with the Bollinger Band indicator moving average (yellow line) on the 6-hour chart.
BTC USD 6-hour chart. Source: TradingView
At the time of writing, buyers have pushed Bitcoin price to $8,232 on a low volume move and the MACD line of the moving average convergence divergence has curled up toward the signal line. Bulls may attempt to push the price higher but the current volume and relative strength index (RSI) reading below 30 dampen enthusiasm.
In the event that buyers continue to press the price higher, a move through $8,300 is required; and above this point, Bitcoin price is capped by the falling wedge descending trendline and the 50-day moving average (black line), which has weighed on the price since Nov. 11.
BTC USD daily MACD, RSI, and Stoch chart. Source: TradingView
The Stoch and RSI on the daily chart suggest Bitcoin could be due for an oversold bounce and traders will notice what could become (depending on the daily close) a double bottom at $8,020.
BTC USD daily chart. Source: TradingView
A bird’s eye view of Bitcoin’s price action on the daily chart shows that double bottoms have been a frequent occurrence often followed by price reversals.
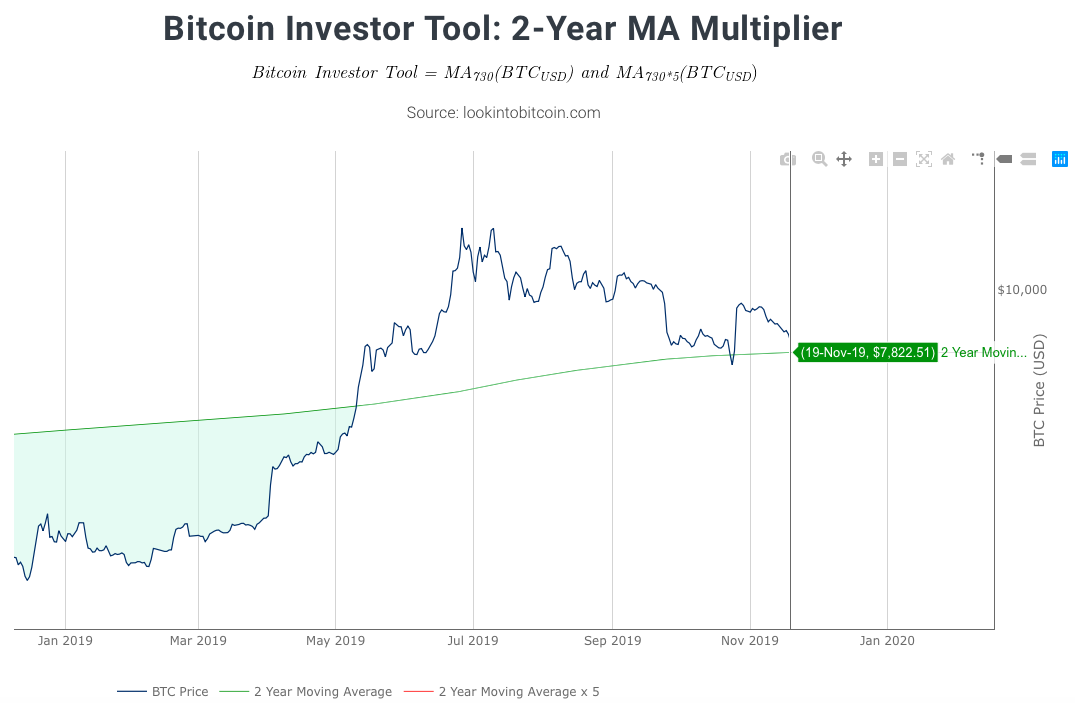
In a newsletter published earlier in the week, crypto analyst Philip Swift suggested that Bitcoin remains in the early phase of a bull market and according to Swift, it is unlikely that the price will drop below $6,000.
As shown by Swift’s Bitcoin 2-Year Multiplier, Bitcoin bounced off after dropping slightly below the 2-year moving average to $7,450. If the price fails to bounce off the 61.8% Fibonacci retracement level, perhaps it will form a double bottom and reverse in this region again.
Bitcoin 2-Year MA Multiplier. Source: Philip Swift
Bearish scenario
Bears foresee buyers failing to purchase a drop to the 61.8% Fibonacci retracement level at $7,845, after which Bitcoin price drops to the $7,500 support. If this fails to hold, Bitcoin could complete a full retrace of the Oct. 25 42% rally to $7,400 which would form a double bottom where price could bounce.
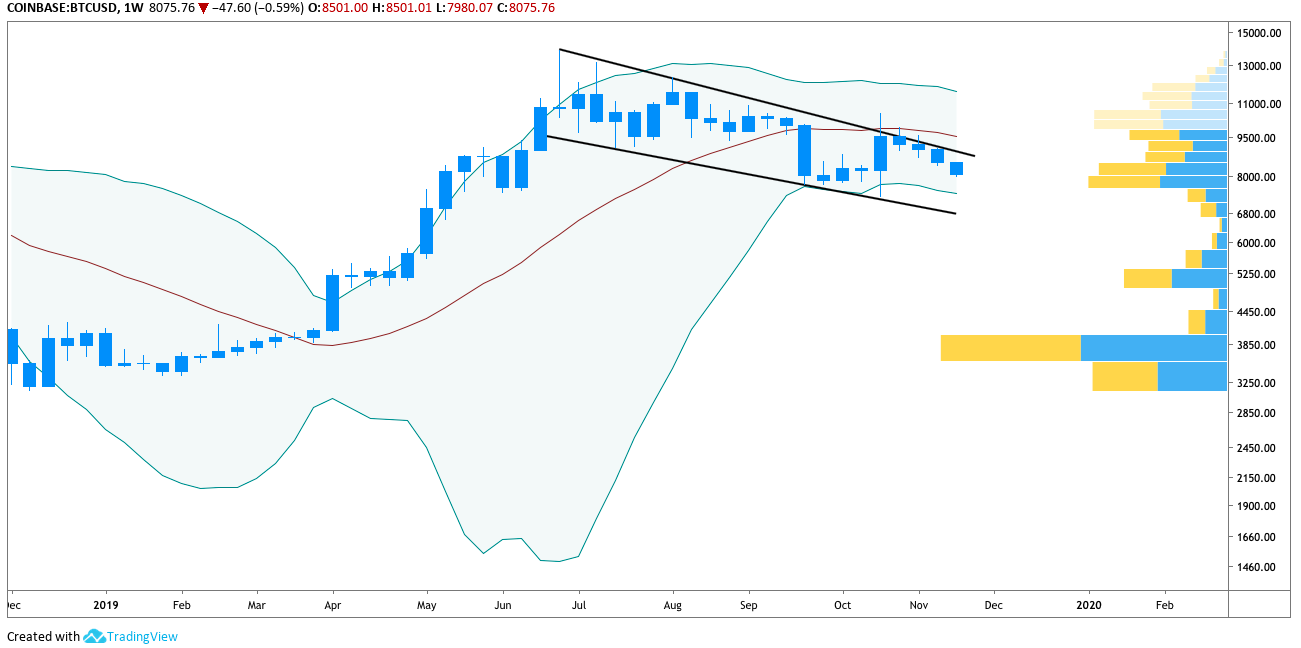
BTC USD weekly chart. Source: TradingView
Looking at the long-term descending channel, BTC could drop to $6,850 where the lower channel arm is. However, this outcome seems unlikely, as the weekly chart volume profile visible (VPVR) range shows Bitcoin price supported from $8,250 to $7,900.
Furthermore, the weekly chart shows the lower band of the Bollinger Band indicator is situated $7,430, quite near the previous bottom on Oct. 23.
Bullish scenario
Over the short-term bulls need to flip the s/r level at $8,300 then move to take out the 50-MA at $8,500. The next step would be to overcome the s/r level at $8,600 which places the price at the overhead trendline of the long term descending channel.
As mentioned earlier, Bitcoin trading volume needs to improve or bears are likely to continue pressing the price lower. In the meantime, traders are encouraged to at least keep an eye on altcoins as some enticing price action has been taking place with many tokens over the last 3 weeks.
The views and opinions expressed here are solely those of the author (@HorusHughes) and do not necessarily reflect the views of CryptoX. Every investment and trading move involves risk. You should conduct your own research when making a decision.


