After a relatively long stagnation phase, volatility has returned, and Bitcoin has done nothing but shoot up. Several indexes suggested that a price breakout was imminent. But nobody would have thought that the $10,000 resistance level will break so easily.
The recent price action sent investors and market participants alike into “greed,” according to the Crypto Fear and Greed Index. Greed, however, is not necessarily a positive sign as one of the most successful investors in the world, Warren Buffett once said:
“Be fearful when others are greedy and greedy when others are fearful.”
Indeed, multiple on-chain metrics advise taking a precautionary approach despite the sense of optimism surrounding the bellwether cryptocurrency.
On-Chain Metrics Spell Trouble
Now that Bitcoin is back above $10,000, it is reasonable to dive into different on-chain gauges to analyze the state of the network. The idea is to identify whether or not the health of its blockchain and the social activity around it support the rally seen in the last few hours.
Bitcoin’s on-chain volume, for instance, leveled off and was steadily declining following the early May peak of $10,045. Nevertheless, the recent price action triggered a spike in on-chain volume, allowing it to make a higher high for the first time in the past month.
If this metric continues to increase, the pioneer cryptocurrency could be poised for a further upward advance.
Bitcoin On-Chain Volume. (Source: Santiment)
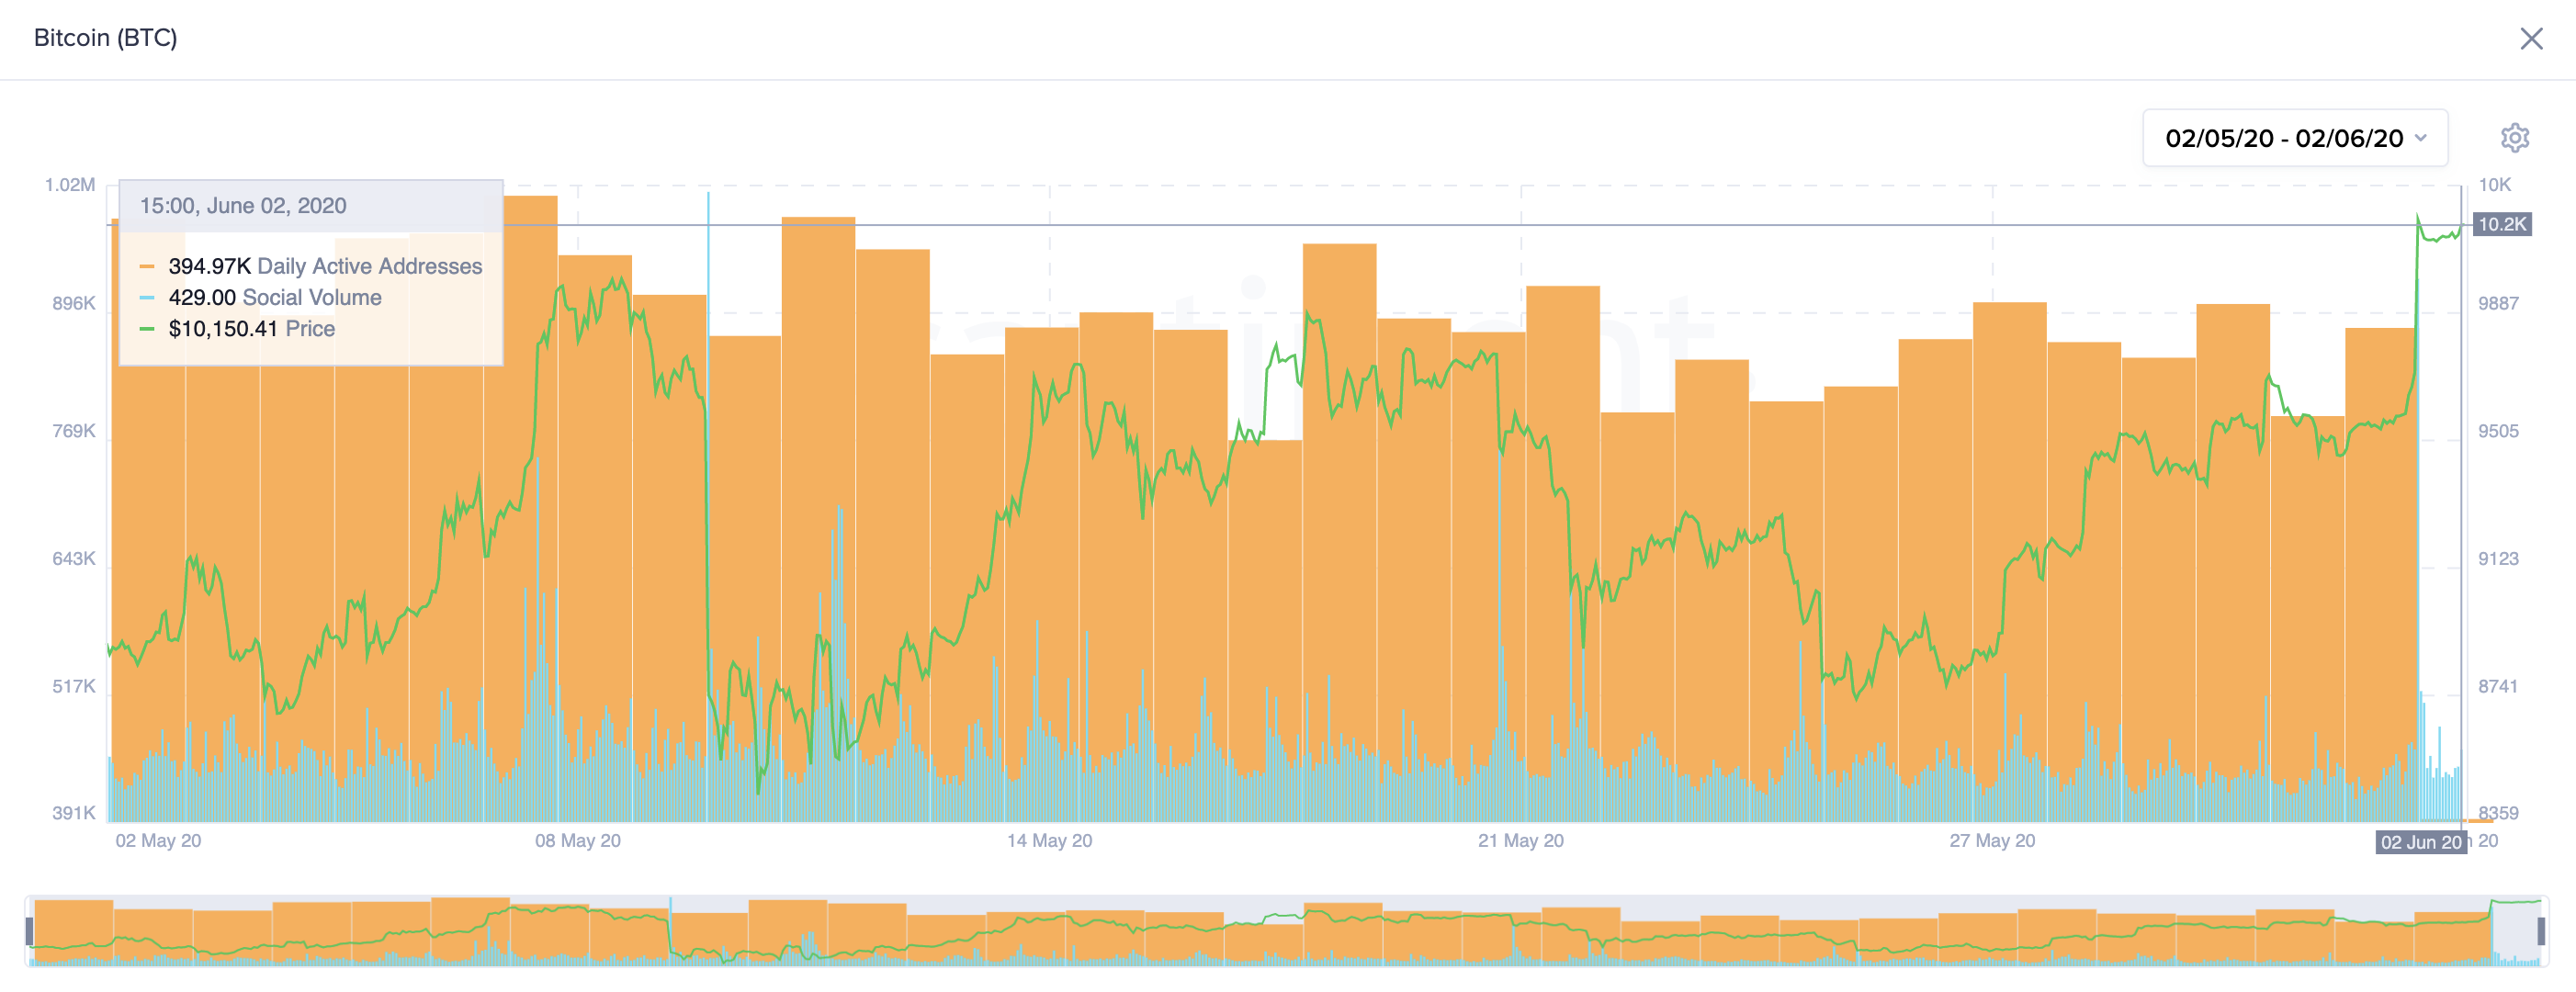
A look at Bitcoin’s daily active addresses and social volume, however, does not seem to justify the recent price action. These two indexes provide a holistic view of the crowd interaction with the flagship cryptocurrency.
Since the beginning of May, BTC’s daily active addresses and social volume continue reaching lower lows, which can be considered a negative sign, according to Santimet.
“With these mixed results in the network’s health, we advise staying cautious here and watching BTC metrics to see which way momentum begins moving over this next week. It will be crucial to see whether #FOMO kicks in now, or profit takers end up taking the safe route with the expectation of buying below $10,000 again,” said the behavior analytics platform.

Bitcoin Daily Active Addresses and Social Volume. (Source: Santiment)
Bitcoin Isn’t Out of the Woods Yet
From a technical perspective, it seems like the bullish outlook will be confirmed once Bitcoin turns $10,500 resistance wall into support. If this were to happen, one could expect a further advance to the 127.2% Fibonacci retracement level at $12,250 since there isn’t any significant barrier in-between.
Bitcoin Sits Between Two Major Supply Barriers. (Source: TradingView)
On the flip side, market participants must pay close attention to the 78.6% Fibonacci retracement level that sits at $9,060. A sudden bearish impulse that sends Bitcoin below this critical support level could jeopardize the bullish outlook.
Under such circumstances, the next supply barriers to watch out for are the 61.8% and 50% Fibonacci retracement levels. These support zones sit at $8,000 and $7,100, respectively.


