

Don’t Buy That Island Yet! Bitcoin Price Settles at $10K… for Now
November 4, 2019 by Ramiro Burgos
Time to settle in? Our weekly technical analysis suggests the bitcoin price may consolidate around the $10,000 USD level in a lateral market between $8,000 and $12,000. Read on to find out the details.
Also read: At Last, the Bitcoin Price Hits $10K Again! But Can It Hold?
Bitcoin Price Technical Analysis
Long-Term Analysis
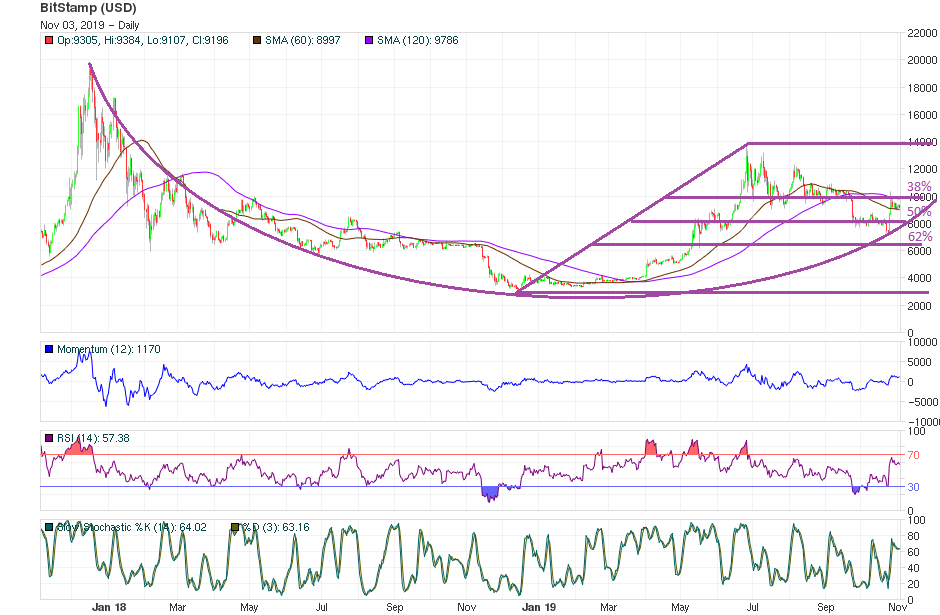
Fibonacci Retracement Numbers Theory points to the current $10,000 level as a theoretical scenario where the market could balance, even if a bearish pull-back drives it back to a Rounded Bottom curve near $8,000. Volatility has increased and a 4,000 basis point range from there to $12,000 would speed quotes up and down — depending on News, Fundamentals and political data.
According to Mass Psychology Analysis, a Hope phase is active due to values staying over their $9,000 support, even if they briefly drop below that psychological mark.
Mid-Term Analysis
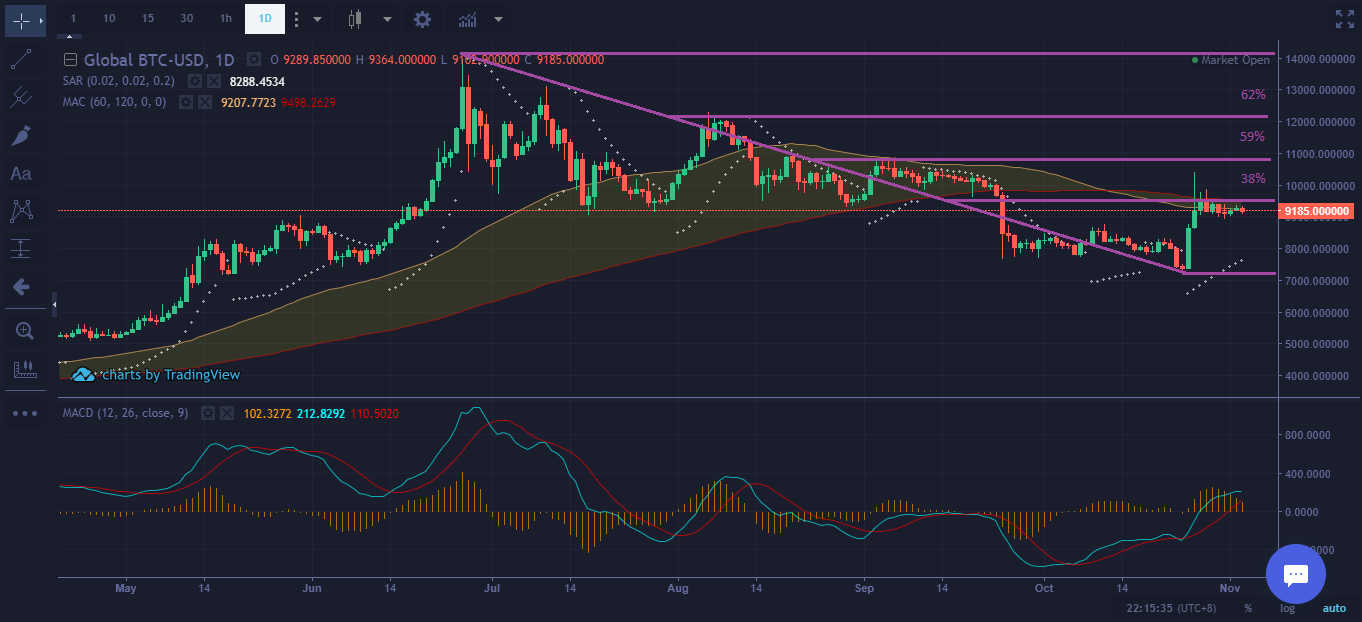
The trendline remains out of its last bearish channel influence, but in a Fibonacci´s mid-term scope, values are also out of a rising chance. They could fall down under the $9,000 support level while exhausted mathematical indicators go down to allow the next upward movement.
The current support could again become a trigger for a rise, if and when prices cross back from below to the up side. Resistance is now at $12,000, but quotes should be driven down by volatility before balancing the lateral market at the current level.
Short-Term Analysis
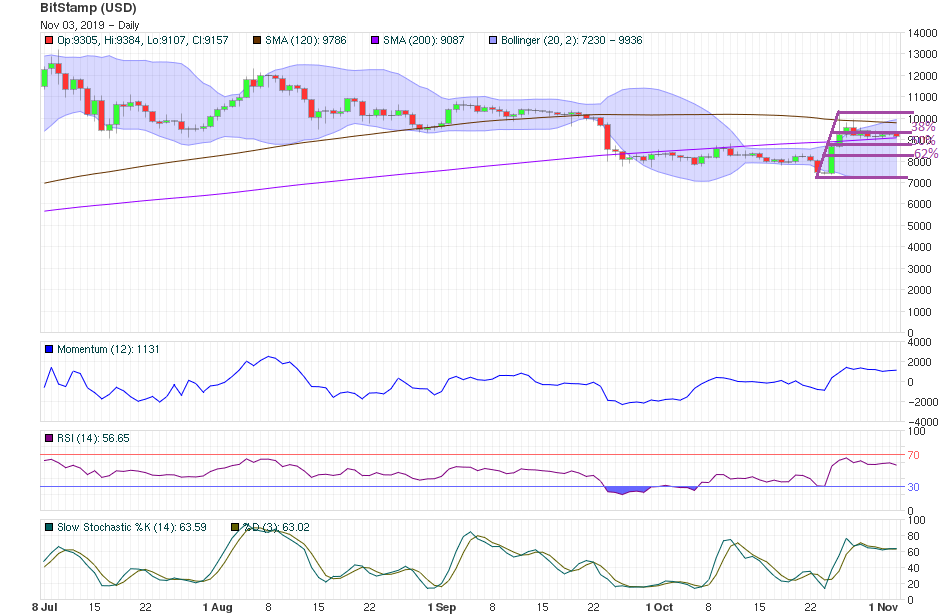
Japanese Candlestick Demand’s soldiers are not strong enough to defend the current $9,000 support, and Offer´s crows are re-entering to an expanded battlefield between $8,000 and $12,000. Even if the main trend remains in a bullish frame, $9,000 seems to be a critical level where the general will gets confused. The signal to consider will be to wait and see if prices recover this level after breaking down.
Bollinger Bands Analysis anticipates values could test $8,000 and $12,000 before balancing out near $10,000.
What do you think will happen to the bitcoin price? Share your predictions in the comments below.
If you find Ramiro’s analyses interesting or helpful, you can find out more about how he comes to his conclusions by checking out his primer book, the Manual de Análisis Técnico Aplicado a los Mercados Bursátiles. The text covers the whole range of technical analysis concepts, from introductory to advanced and everything in between. To order, send an email to [email protected]

Images via Pixabay, Ramiro Burgos
This technical analysis is meant for informational purposes only. Bitsonline is not responsible for any gains or losses incurred while trading bitcoin.


