Ethereum, like Bitcoin and other assets following the Black Thursday collapse, have made a strong recovery and regenerated most of the gains lost during the epic selloff.
And while things have been looking positive for Ethereum, a doji forming on monthly timeframes shows indecision among investors. But this isn’t always a bad thing and has led to further upside in the past.
Ethereum Investors Showing Indecision, Will The Number Two Crypto Rise or Fall?
Ethereum kicked off 2020 with a powerful rally. After nine consecutive weeks of bullish price action and green candle closes, the number two cryptocurrency by market cap had increase by over 100%.
But then Black Thursday happened and high-risk assets like Bitcoin, Ethereum, and many other crypto assets were dumped alongside stocks, precious metals, and everything else that could be sold.
Related Reading | Over 359 Companies Are Building The Future On Ethereum
The mad dash for liquidity resulted in a catastrophic collapse across all markets.
Since then, Ethereum has been struggling to reclaim highs traded at just before the fall. Over the last month, the smart-contract focused crypto asset has made a steady climb, but has seen some pullback in recent days.
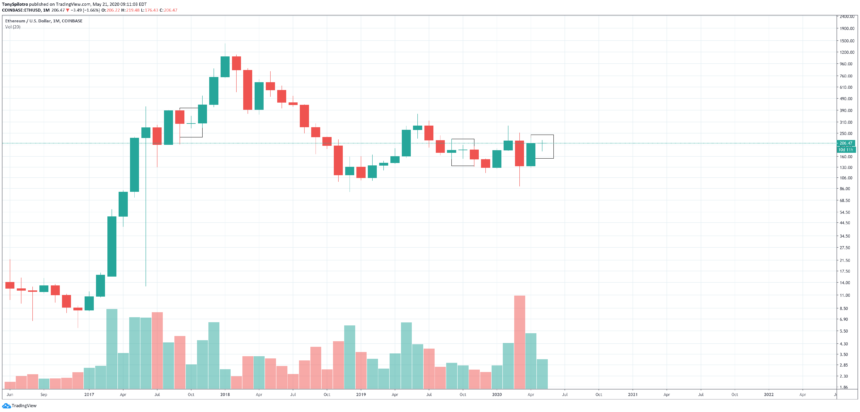
Investors are showing indecision, which can be seen in the formation of a doji candlestick on the May monthly candle on Ethereum price charts.
Doji Candlesticks Explained And How It May Impact ETH Prices
Doji candlesticks show that indecision is present in the market, and buyers and sellers are demonstrating a similar amount of strength.
Dojis occur when price action closes at the same value it started at around open. Most often, there are wicks or shadows to the upside and downsize, showing a push from both buyers and sellers that ultimately went nowhere.
These candles are rare on the highest timeframes. Two previous monthly candles have closed with a similar shaped green doji.
One was just before the final push that brought Ethereum to its all-time high in late 2017. The most recent one, was in late 2019, just before a major, two month drop.
Related Reading | Double Dragon: Is Ethereum Ready For Violent Reversal?
Ethereum price is currently trading at just above $200. Losing the level could cause the asset to retest lows. Alternatively, a break higher could cause the asset’s price to soar. It also could mean a bigger push for the rest of the crypto market as well, as Bitcoin consolidates below key resistance.
An abundance of long interest is working against the asset currently, but growth in DeFi and the upcoming ETH 2.0 launch could provide the bullish momentum the battered crypto asset needs to make a strong recovery towards all-time high.
Featured image from Shutterstock


