On-chain data shows Bitcoin exchange reserves continue to decline despite the recent dips, as values reach lowest since 2018.
Bitcoin Exchange Reserves Continue To Go Down
As pointed out by a CryptoQuant post, the BTC all exchanges reserve is moving down despite the recent downtrend in the price of the cryptocurrency.
The Bitcoin all exchanges reserve is an indicator that shows the total amount of coins held on all centralized exchange wallets. A dip in the value of the metric suggests investors are transferring their BTC to personal wallets, either for holding or for selling through OTC deals.
On the contrary, an increase in the indicator implies investors are sending their coins to exchanges for withdrawing to fiat and stablecoins, or for purchasing altcoins.
Here is a chart showing how the Bitcoin exchange reserve has changed over the years:
The exchange reserve continues to decline
As you can see from the above graph, the BTC all exchanges reserve has hit lows not seen since 2018. Usually, during periods of big price swings, the indicator’s value shows a spike as investors look to shift their positions in the market.
Related Reading | Bitcoin Holders Take Profits As Price Falls, Indicators Remain Bullish?
However, despite the recent dips, the metric has only been trending downward. What’s the reason behind this? Well, one possible scenario could be that there are now more long-term holders in the market that are waiting for the price to appreciate further before they make any moves.
A downtrend in the exchange reserve is often a bullish indicator as it shows buyers are accumulating Bitcoin, while an uptrend could lead to crashes in the crypto.
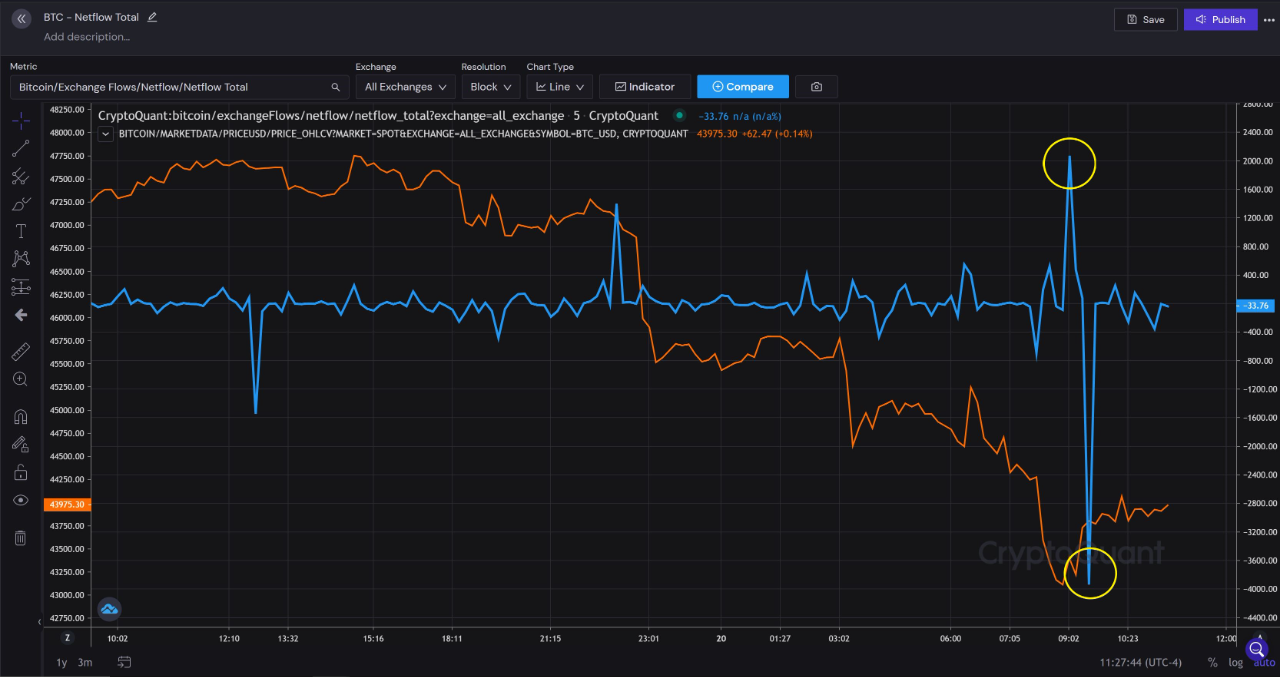
Below is another chart that shows the BTC netflow indicator over the last couple of days.
Looks like the Bitcoin netflow showed a huge negative spike yesterday
The netflow indicator measures the net number of coins exiting or entering exchanges. As is apparent from the above graph, the metric had a big negative spike yesterday, which implies a large amount of BTC was pulled off exchanges.
Related Reading | Did Turkey’s President Say “We Are In A War Against Bitcoin”? An Investigation
BTC Price
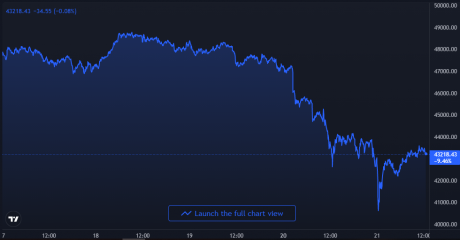
Yesterday, Bitcoin’s price crashed down to $40k after peaking just below $49k a few days back. But the price has since jumped back a bit as it floats around $43k at the time of writing. The crypto is down 7% in the last 7 days, while over the past 30 days, the value is 11% less.
Here is a chart showing the trend in the price of the coin over the last five days:
BTC's price crashes down to $40k, but quickly recovers back up a little | Source: BTCUSD on TradingView
Featured image from Unsplash.com, charts from TradingView.com, CryptoQuant


