A reoccurring theme in many Bitcoin analyses over the past few weeks has been mentions of a “rising wedge.”
For those unaware, a rising wedge is a common chart pattern marked by a strong uptrend. Although this uptrend may seem bullish from a top-down perspective, rising wedges are textbook reversal patterns.
Per Investopedia, this form of technical analysis wedge is often seen amid bear markets, and often result in the asset falling, especially if volume across the period analyzed consistently trends lower.
Ever since Bitcoin started to form an uptrend in the wake of the mid-March crash to $3,700, analysts have asserted that the asset is forming a textbook rising wedge, likening BTC’s chart to classic rising wedges.
There was even one analysis by a crypto trader that accentuated that BTC’s structure looked exactly as it did prior to the start of the dump from the $9,000s to $3,700 over the span of a week. This analysis, which depicted the cryptocurrency trading in a steep rising wedge, can be seen below.
Chart from @CryptoDonAlt (Twitter)
But amidst the surge that transpired on April 29th, Bitcoin invalidated this bearish factor, only adding fuel to the cryptocurrency bull case.
Bitcoin Invalidates Crucial Bearish Sign, Setting Stage for Strong Rally
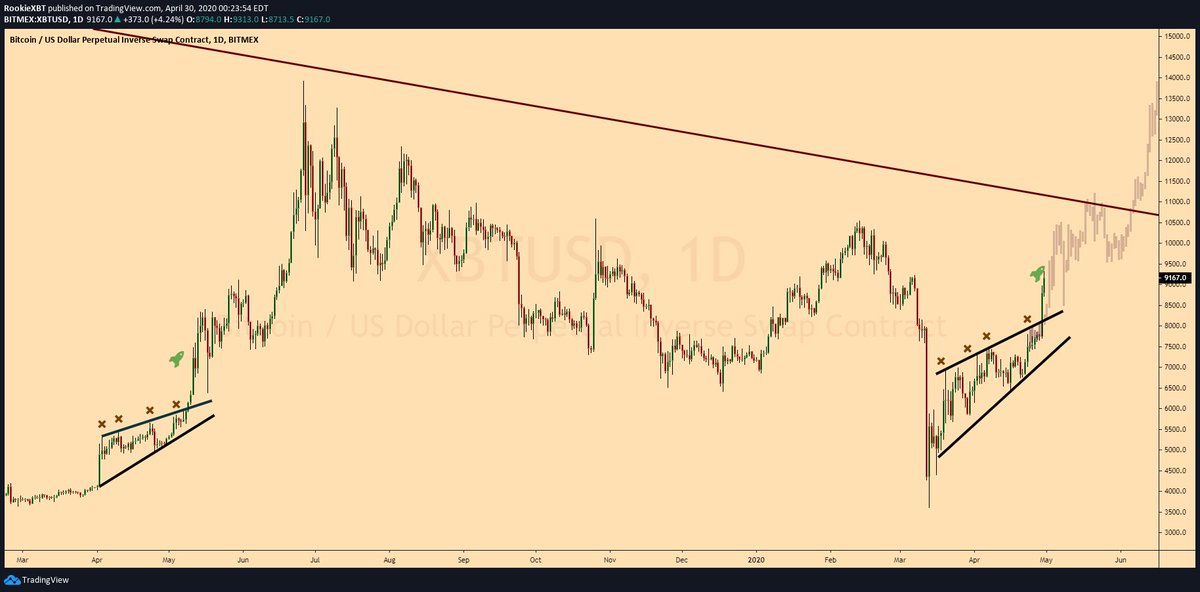
During the surge over the past two days, BTC has decisively broken above the rising wedge, beating out the high probability it had of breaking below this classic chart formation.
As a crypto trader pointed out below, the rising wedge that had constrained Bitcoin’s price for the past six weeks has been decimated, with clear invalidation to the upside.
What’s especially notable about this formation of BTC breaking above a rising wedge after a bear market, this is the exact same market structure that marked the start of 2019’s bull run, which brought prices from the $4,000s to $14,000 in three months’ time.

Chart from @RookieXBT (Twitter)
History rhyming, as the trader’s chart seen above shows, will see Bitcoin rally past $14,000 by the start of June.
What’s Behind the Explosive Move?
With the cryptocurrency market somehow beating the odds to break a rising wedge to the upside, some have been left wondering what has managed to push Bitcoin higher.
Executives recently had an answer to this pressing question, sharing their opinions with Bloomberg.
Roch Rosenblum, the co-head of trading at GSR, remarked that the ongoing BTC rally is predicated on the macroeconomic environment:
“This latest run past $8,000 is as much about positive macro sentiment as it is about the upcoming halving. We’re starting to have a lot more certainty, as more countries begin to share their plans to reopen the economy in May.”
This optimism was echoed by Zac Prince, a co-founder of BlockFi, who said that the “current market dynamics are driving a bolstered interest [for] digital currency.” These dynamics he was referencing was the Federal Reserve’s commitment to money printing and the growth in stablecoins.
Photo by Liza Rusalskaya on Unsplash


