Chainlink (LINK) has been on fire, blazing its own trail independent from the rest of the market. The digital asset appears to be in the beginning stages of a strong uptrend on the charts, backed by a devoted community and several significant news headlines this year.
Chainlink’s recent price action is notable because of its timing and independence from the rest of the crypto market. Sentiment around Bitcoin (BTC) has been noticeably bearish since its fall from a multi-month consolidation pattern on Sept. 24. Bitcoin is firmly positioned as the crypto market’s leading asset, meaning that overall market sentiment has been correspondingly bearish.
Additionally, altcoins often move together in price, depending on Bitcoin’s price and sentiment. Seeing the top market leaders, such as Ether and XRP, trend upward together is not out of the ordinary, especially if Bitcoin’s price also rises at the same time. Most altcoins, if they are moving at all, are currently fluctuating in step with Bitcoin. Chainlink, however, has had a mind of its own lately, acting as an outlier and providing hope that altcoins may have a future after all.
Daily crypto market performance. Source: Coin360.com
LINK USDT daily chart. Source: TradingView
Daily LINK price chart
Paired against Tether (USDT), Chainlink shows significant strength as it fights through a block of resistance between $2.52 and $2.75. So far, the asset has reached an Oct. 8 high of $2.65, sitting at $2.55 at press time.
Just a few weeks before LINK posted its all-time price high of $4.59 in June 2019, Chainlink announced a collaboration with Google Cloud amid an overall bullish cryptocurrency market. Sentiment for Chainlink has been on the rise since the announcement.
Bullish scenario
LINK posted a very nice bottoming pattern through September, entering October with strength. The token also saw a healthy correction between Oct. 2 and Oct. 6, providing rationale for a more sustainable uptrend than if the asset painted 14 green days in a row.
If LINK breaks past $2.75, it faces resistance at $3.25, $3.75 and $4.59, the asset’s all-time price high set on June 29, 2019. Past $4.59, the asset would enter price discovery mode, facing no historical resistance.
Interestingly, Chainlink’s all-time high did not occur during crypto’s most recent altseason in Jan. 2018, when almost every cryptocurrency other than Bitcoin rose tremendously in price over a period of weeks. LINK only tapped a high of $1.39 back then.
Chainlink’s all-time high came on June 29, 2019, three days after Bitcoin posted its yearly high of $13,878 on June 26. LINK has since decoupled from Bitcoin’s price movements, setting a trend of its own, a rare occurrence in the cryptocurrency space.
Bearish scenario
Currently on its third consecutive green daily candle, LINK could see a pullback, cooling the token down before another leg up.
If pullback occurs, the 100-day moving average (MA) sits at $2.26, which already held as support when price wicked down to it earlier today. In the case of a more significant correction, LINK’s 200-day MA lies at $1.62.
In contrast, Bitcoin has tried to regain its 200-day moving average as support several times since its Sept. 24 drop, but has failed each time.
Chainlink’s 0.5, 0.618, 0.705 and 0.786 Fibonacci levels might also prove significant if the asset corrects from a local high of $2.65. Those Fibonacci points occur at $2.06, $1.92, $1.82 and $1.72 respectively.
Additionally, LINK has support at its most recent bottom, around $1.54.
Ether’s role in the altseason equation
Historically, the crypto market’s largest altcoin, Ether, has sometimes led the charge in terms of altseason — or at least renewed altcoin strength.
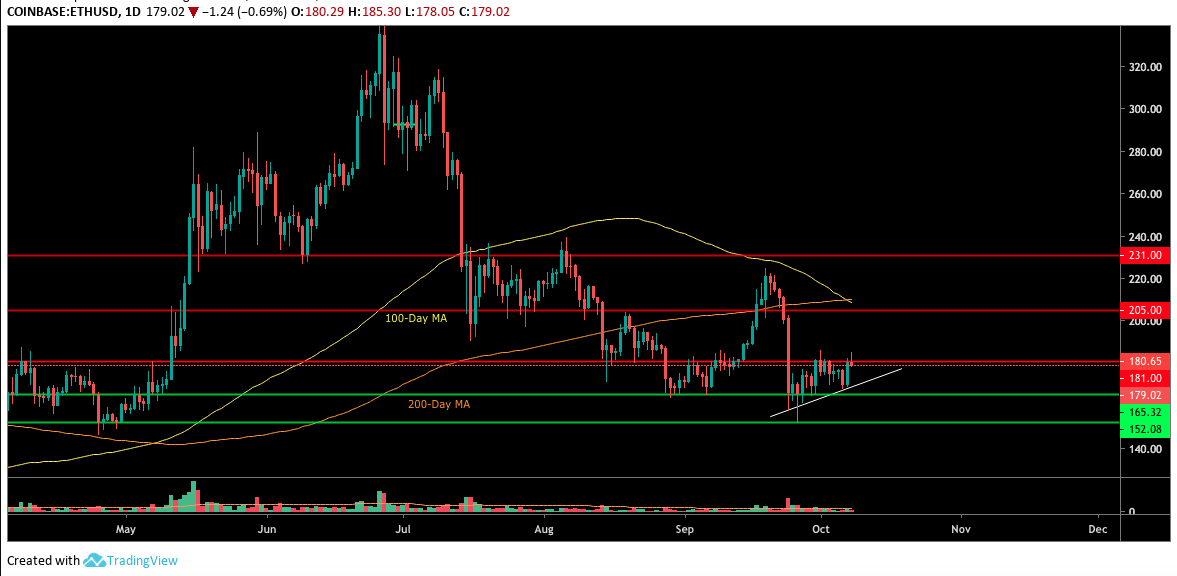
ETH USD daily chart. Source: TradingView
Paired against the U.S. dollar, Ether’s daily chart looks similar to LINK’s chart during its bottoming pattern several weeks ago. The past few weeks have provided what looks to be the beginning of an uptrend for Ether.
In contrast to Chainlink, however, Ether has a more difficult road ahead. At press time, Ether fights a level of resistance at $181. The coin also needs to defeat its next closest levels of resistance at $205 and $231.
Ether recently suffered a bearish moving average cross, seeing its 100-day MA cross under its 200-day MA. Those key moving averages also sit above Ether’s price as resistance, between $208 and $211.
Ether priced against BTC
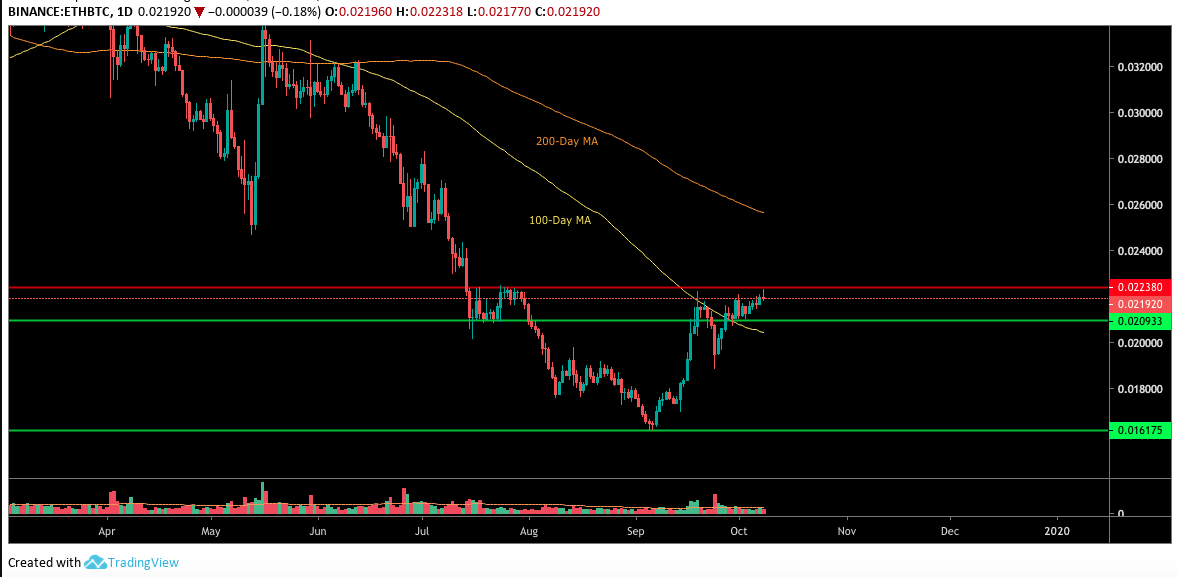
Ether shows further strength when priced against Bitcoin, which may be a key factor in showing altcoin optimism.
ETH BTC daily chart. Source: TradingView
Paired against BTC, Ether shows a trend that is further along than its USD counterpart. Ether has already regained the 100-day MA and flipped the 0.0219 level from resistance to support.
By comparison, however, Ether’s BTC pairing fell further than its USD pairing, leaving more ground to make up in its journey to recovery. Ether also recently faced rejection from resistance at 0.0223
Still, Ether looks to have turned a page, at least for now.
The views and opinions expressed here are solely those of (@benjaminpirus) and do not necessarily reflect the views of CryptoX. Every investment and trading move involves risk. You should conduct your own research when making a decision.


