Binance coin (BNB) bulls look set to break key resistance with so much buying pressure that could send BNB price higher.
The price of BNB looks really strong after showing some positive signs in the past few days with a lot of bids created by BNB bulls driving the price of the coin despite the market uncertainty.
BNB Daily Chart Analysis
The daily chart for BNB shows it is trading at $304.5 despite Bitcoin (BTC) trading at key support after falling from a region of $23,100. The price of BNB looks strong despite the market looking bearish which suggest bulls are holding on to the price of BNB.
BNB is trading above the 50 exponential moving average (EMA) but trading below the 200 exponential moving average (EMA). BNB broke above the 50 EMA on the daily chart with good volume and made a clean retest before showing more bullish signs.
The first major resistance for BNB corresponds with the 200 EMA, successful break and hold above this region could send BNB to a region close to $380.
On the daily chart, the price of BNB formed a bullish trend in a symmetric triangle with a successful breakout which confirms bulls could easily push the price of BNB to break its key resistance if market conditions are favorable.
Major resistance on the daily chart – $327.40.
Major support on the daily chart – $270.
BNB Price Analysis On The 4H Chart

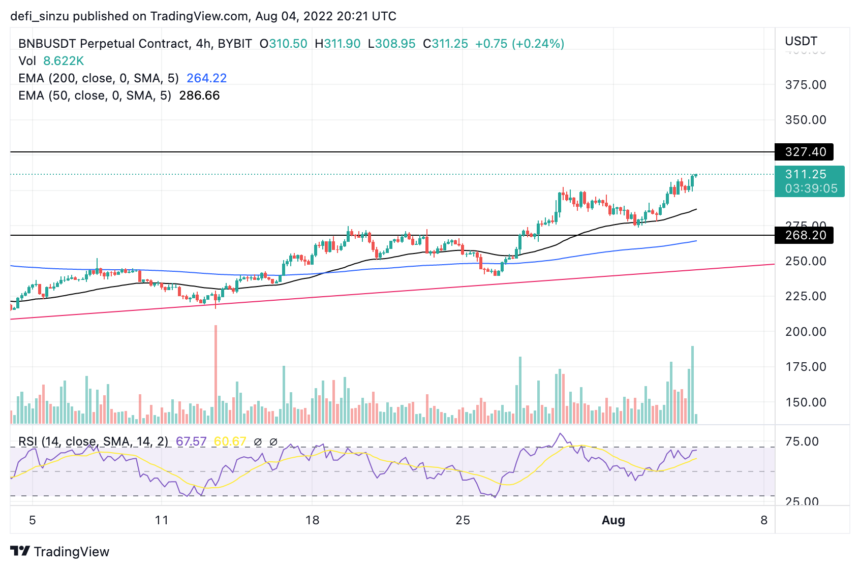
The price of BNB on the 4H chart shows the price is in an uptrend with swing highs towards the resistance at $327.40. BNB needs to break the key resistance for more upside to be possible but if the trend is not sustained BNB could retest supports at $297.25 and $285.
BNB is trading above the 50 & 200 EMA, indicating an uptrend direction for the period until invalidated or fails to break above the resistance level of the $327.40 mark.
If BNB fails to reclaim or break above the resistance of $327.40, it would likely revisit the 4H support region of $297.25.
Resistance on the 4H chart – $327.40.
Support on the 4H chart – $297.25, $285.
BNB 1H Chart Analysis
The price of BNB on the one hourly timeframe looks good.
The price of BNB is above 50 & 200 EMA.
The relative strength Index (RSI) is above 60
The volume shows strong buy bids
Resistance on the 1H chart – $327.40.
Support on the 1H chart – $297.25.
BNB is a strong project with a good use case and would always have bids placed should the price goes lower as the price is backed fundamentally.
On a low and high timeframe, BNB looks really strong and bullish with bulls ready to push the price higher. With a successful break of the key resistance, BNB would have a good rally.
Featured image from Watcher Guru, Charts from TradingView.com


