

This is a daily analysis of top tokens with CME futures by CryptoX analyst and Chartered Market Technician Omkar Godbole.
Bitcoin: Bull Market Pullback Underway
The bitcoin
market rally has stalled in the past 24 hours as expected, but instead of consolidation, prices have pulled back over 5% to $116,800 from record highs in a move typical of a bull market pullback. Reports suggest that profit-taking by long-term holders is weighing on the cryptocurrency’s price.
It’s common for markets to revisit breakout points, in this case, the May 22 high of around $111,960, and test the underlying buying interest before chalking out bigger rallies. A similar dynamic played out earlier this year as prices dropped from over $100,000 of $75,000, revisiting the breakout point from late 2024.
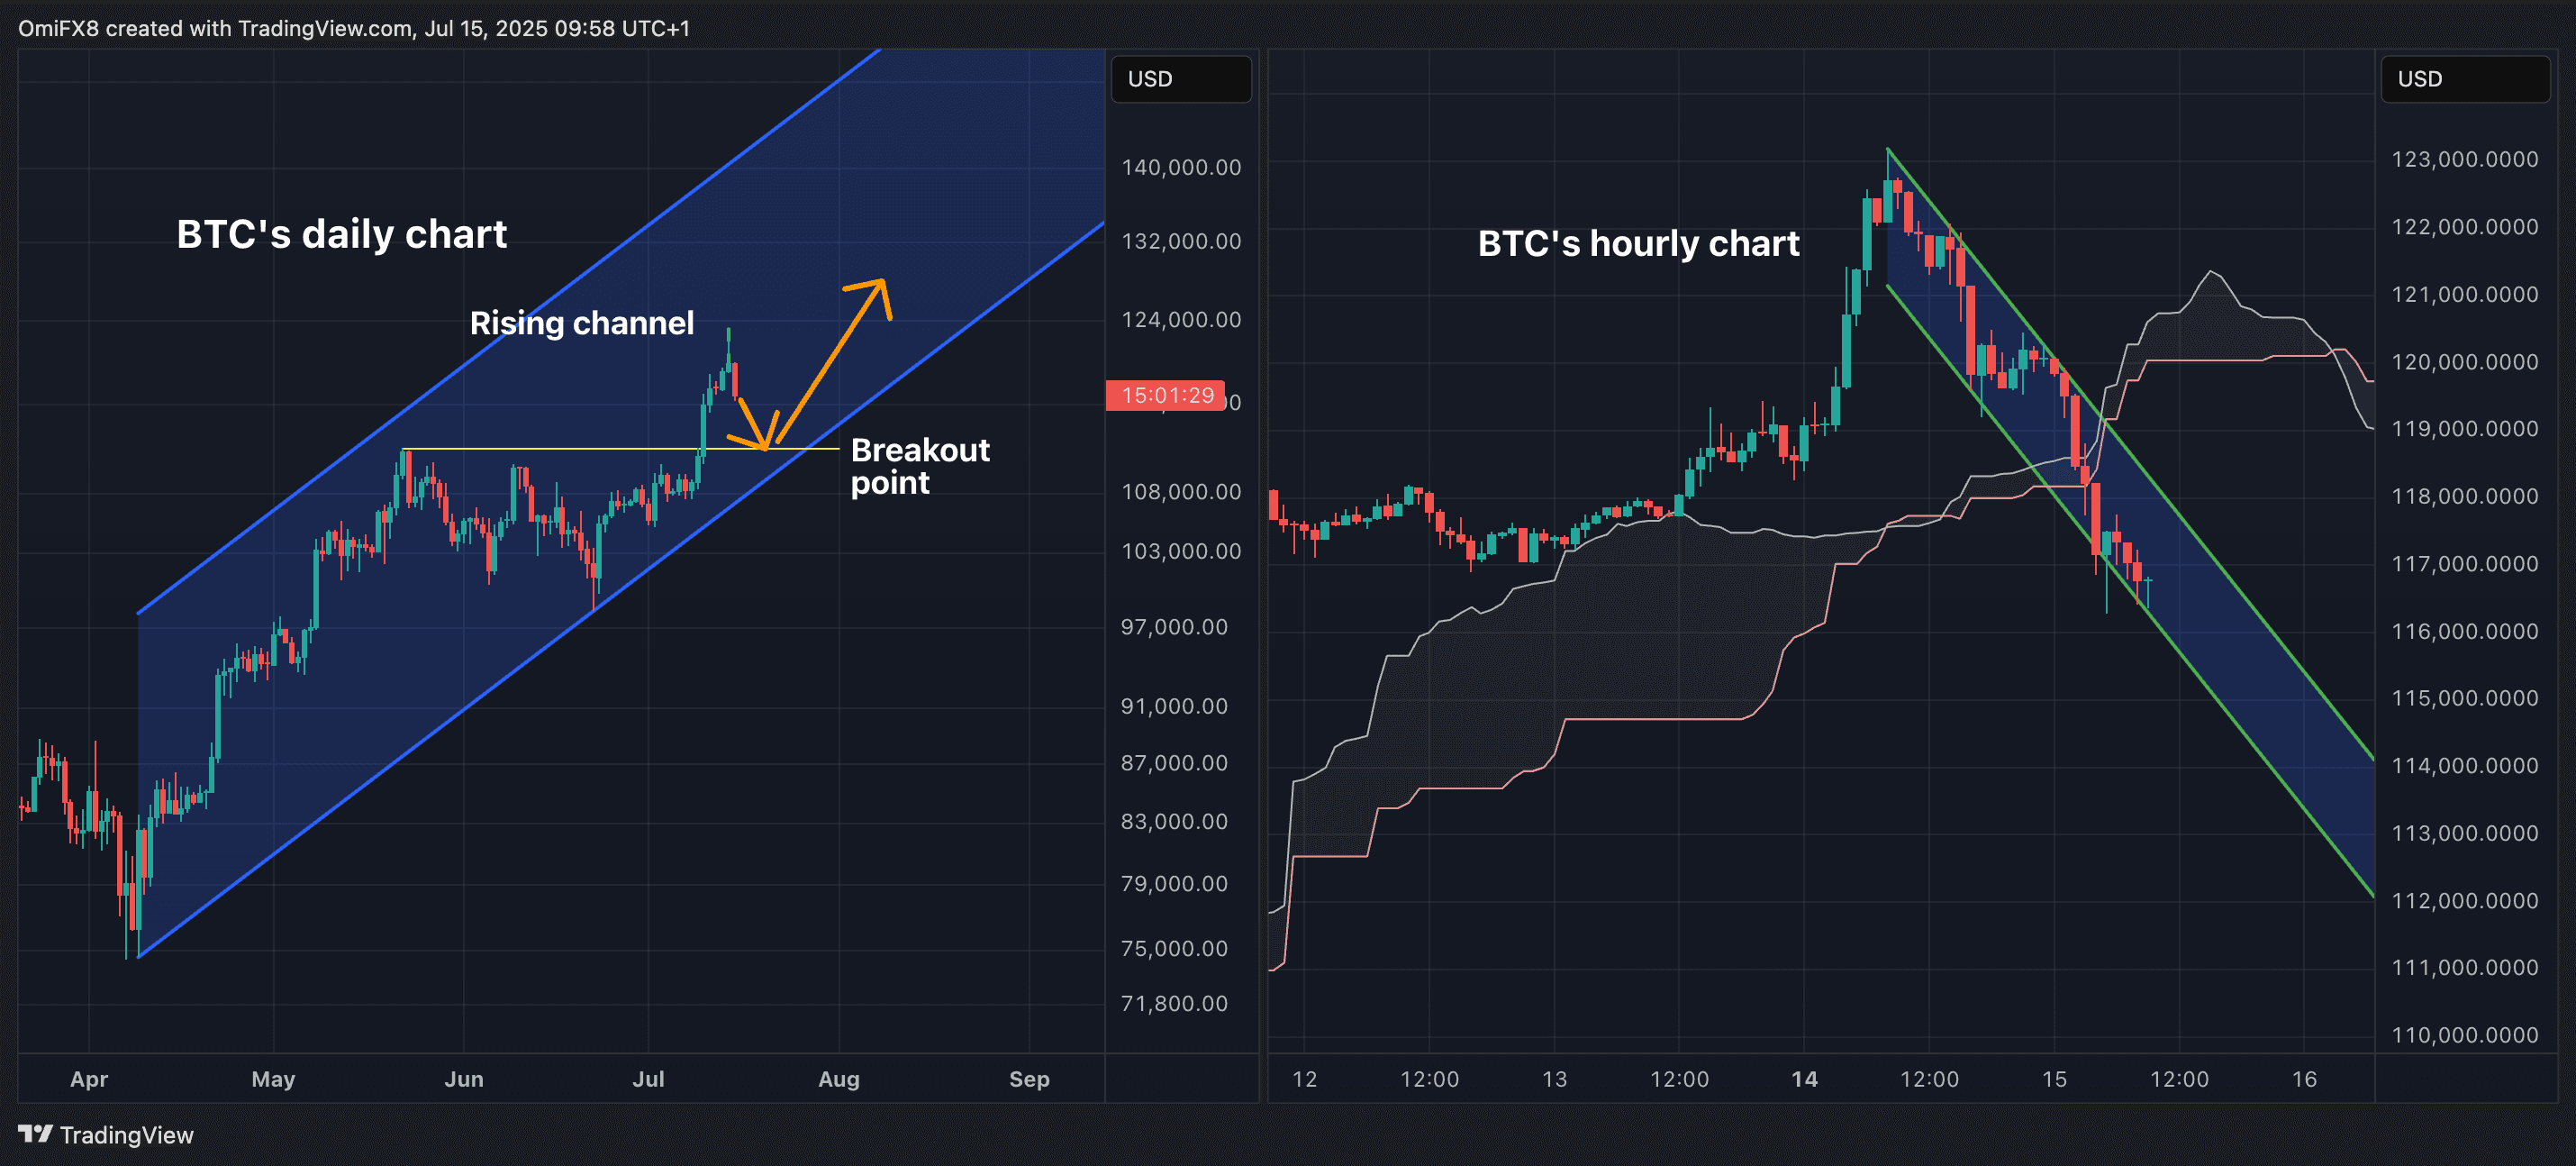
From a technical analysis perspective, the broader bullish bias will prevail while prices remain locked in the ascending channel on the daily chart. Over the next 24 hours, the focus will be on the hourly chart, which shows a steep corrective trend lower, with prices trading below the Ichimoku cloud to suggest bearish momentum.
However, the RSI on the hourly chart has dropped below 30, indicating an oversold condition – a stark contrast to the above-70 or overbought reading seen a day ago. So, a bounce cannot be ruled out. The probability of a pullback to $111,960 would weaken if the potential recovery ends the downward-trending channel. Such a move will likely result in fresh record highs.
Open interest nears record high
Volatility could remain high as cumulative open interest in onshore and offshore futures and offshore perpetual futures has increased to 734.82K BTC, which is just shy of the record 744K BTC in October 2022, according to data source CoinGecko.
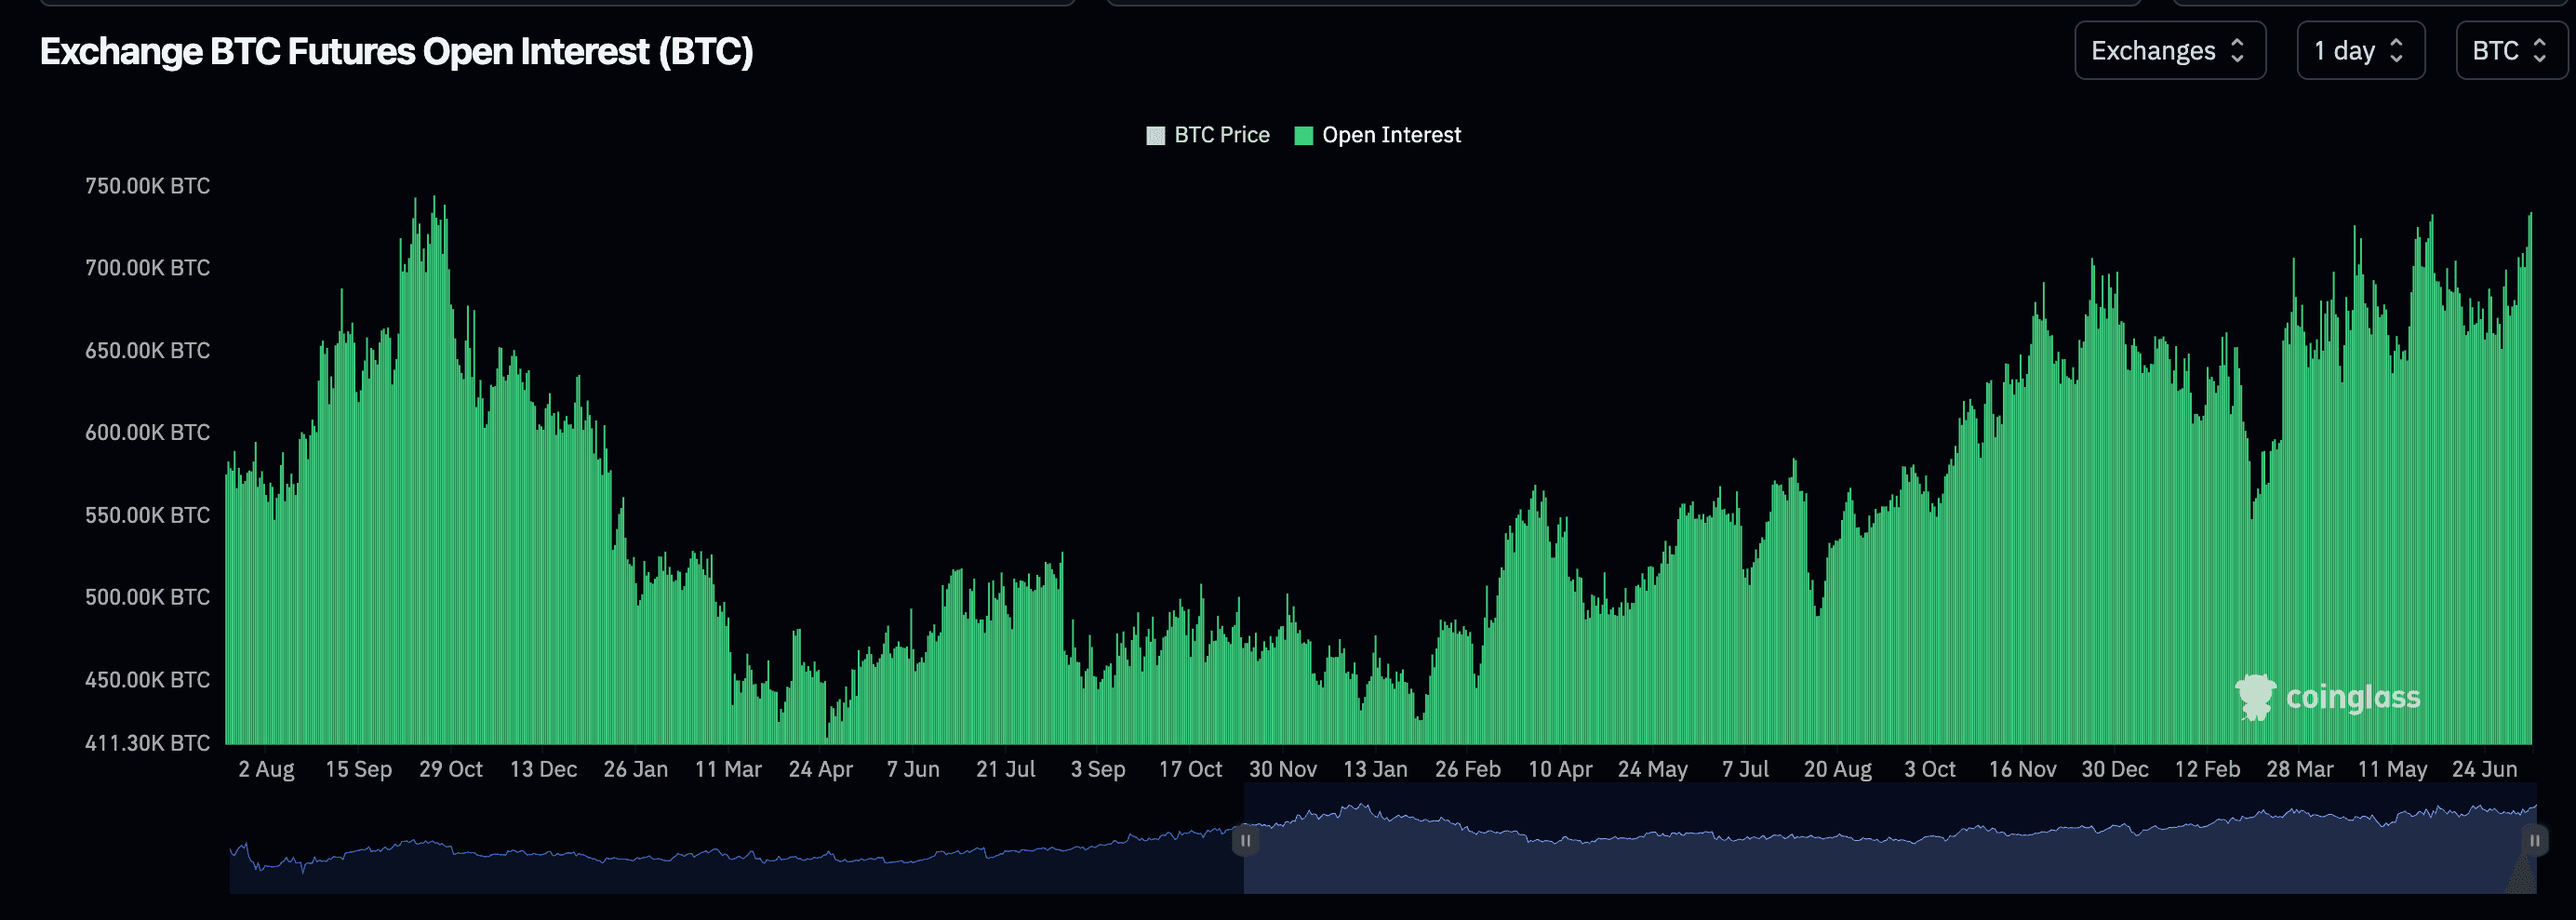
The growth in open interest is likely being led by offshore exchanges as the number of active contracts on the CME remains below the May high, with the three-month annualized basis still below 10%. Conversely, annualized funding rates on offshore perpetuals have topped 11%, indicating a growing demand for the bullish exposure.
MOVE Index turns higher
The MOVE index, which gauges 30-day implied volatility in U.S. Treasury notes, has rebounded from a critical level that has consistently foreshadowed sharp spikes in market volatility since 2024.
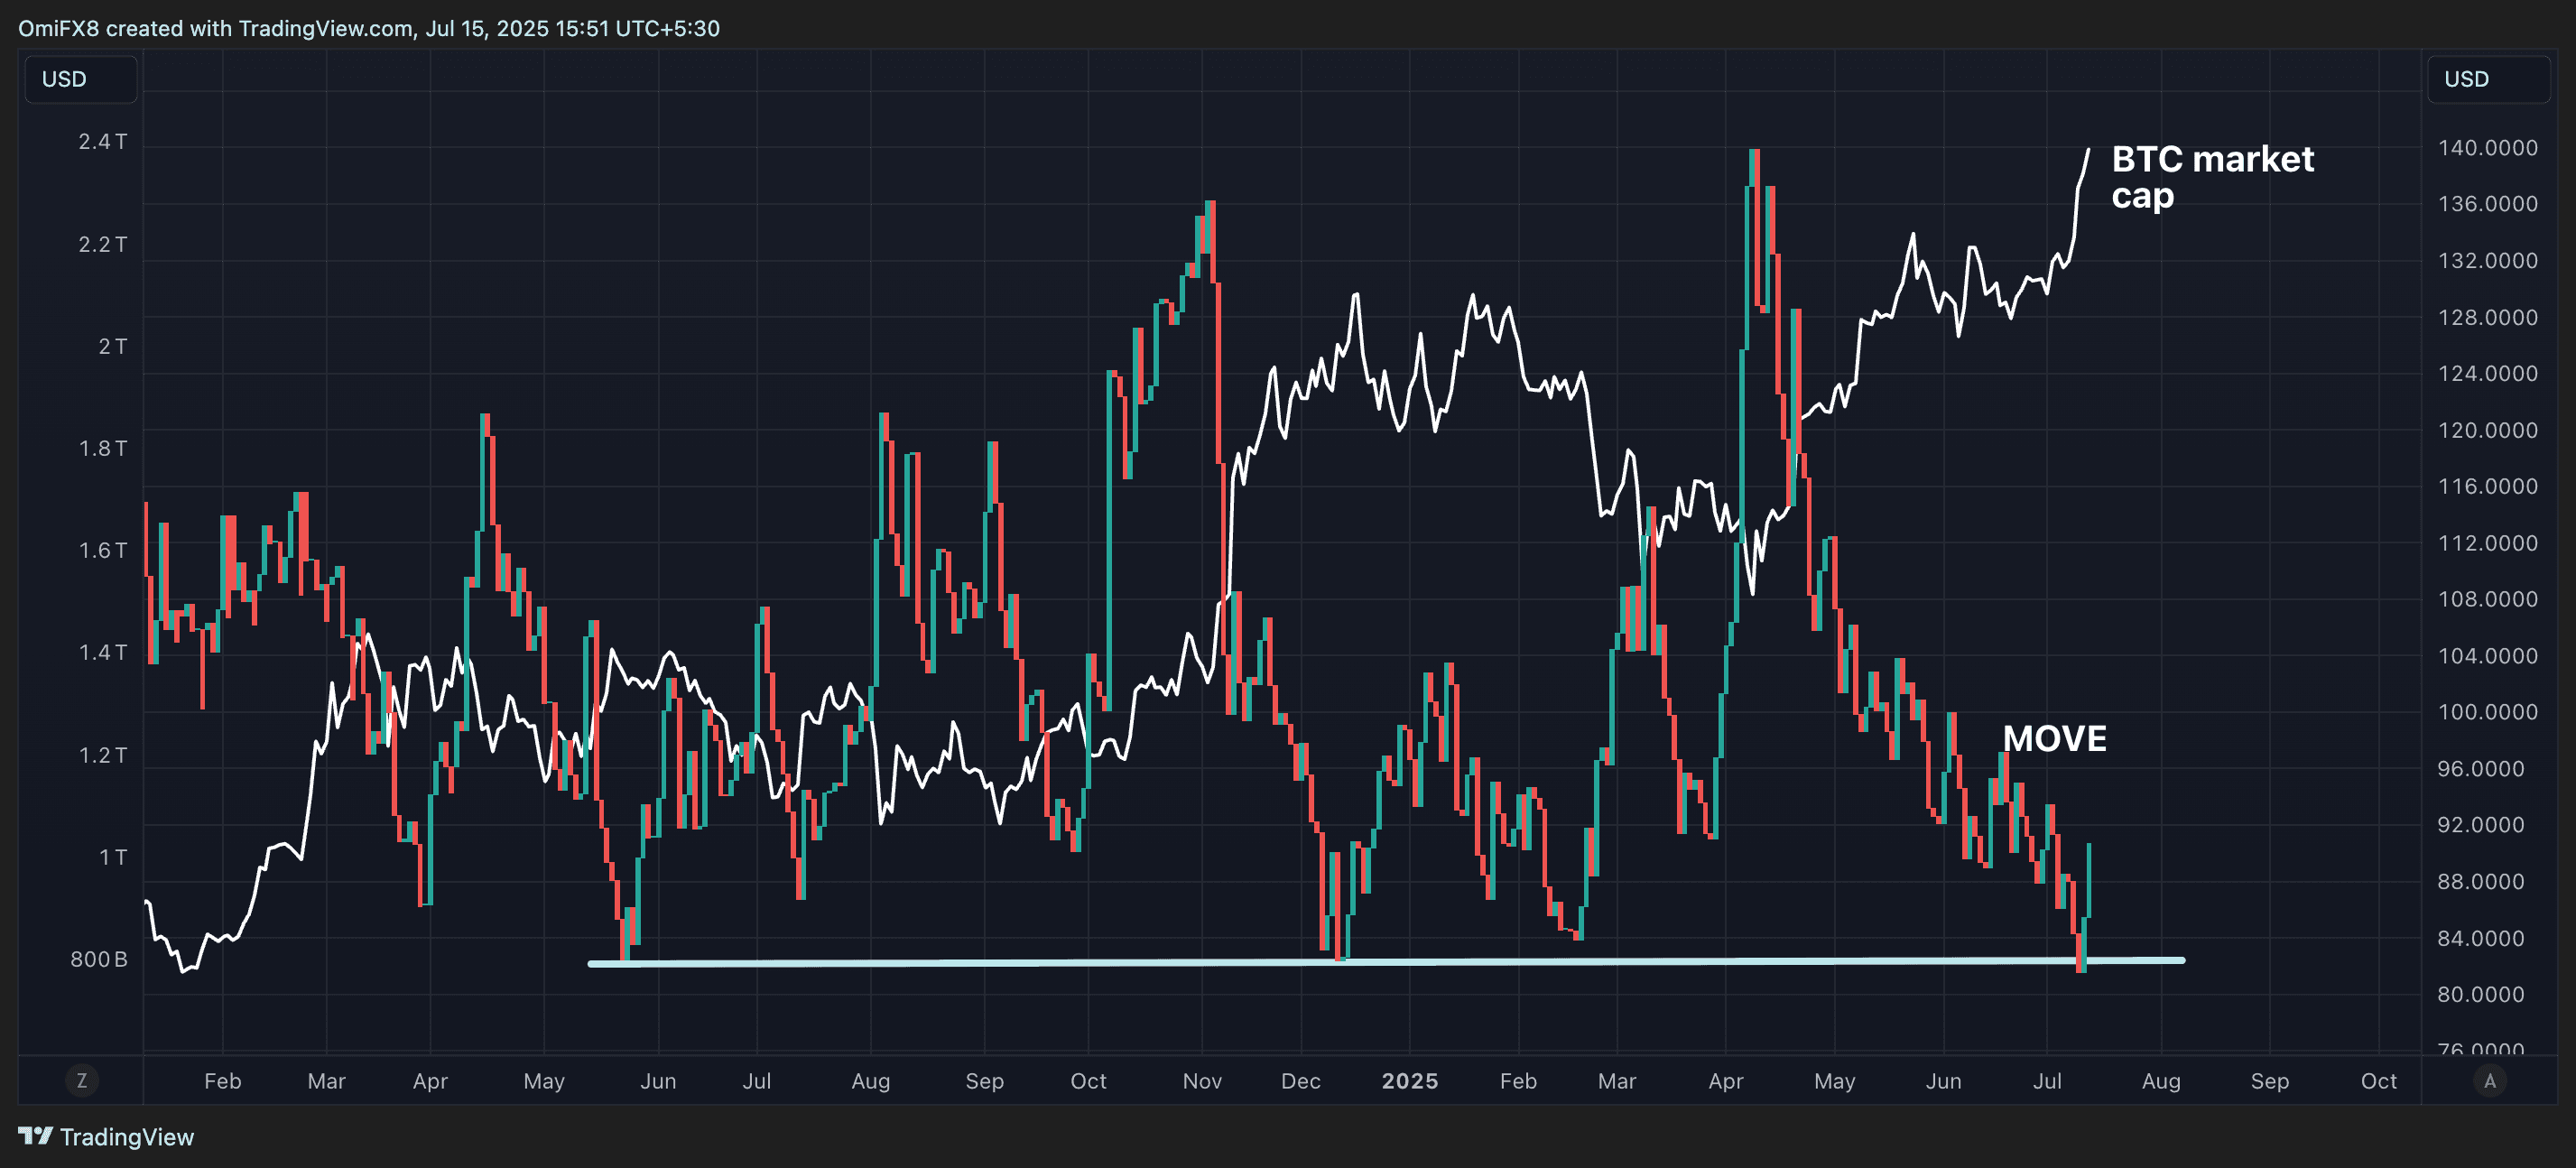
That’s a cause for concern for the bulls because volatility spikes in the Treasury market tend to lead to financial tightening, a risk-off development. Moreover, since 2024, bottoms in MOVE have marked interim BTC price tops.
Watch out for the history to repeat itself, leading to a deeper BTC bull market pullback.
- AI’s take: Bitcoin’s 5% pullback is a healthy bull market feature, aiming to retest the key breakout level of $111,960 before potentially initiating a stronger rally.
- Resistance: $118,000-118,500, $120,000, $123,181
- Support: $113,688 (the 38.2% Fib retracement of the rally from June 22 lows), $111,965, $107,823 (the 61.8% Fib)
XRP: Holds 100-hour MA and cloud support
XRP
has dropped from $3 and appears to be trapped in a downward-trending channel on the hourly chart, mirroring BTC. Still, XRP appears relatively better off, holding the confluence of the 100-hour simple moving average (SMA) and the Ichimoku cloud at $2.81.
A breakout from here would imply an end to the correction and resumption of the broader uptrend toward the yearly peak of $3.4. On the way higher, bulls will likely be tested again at around $3.
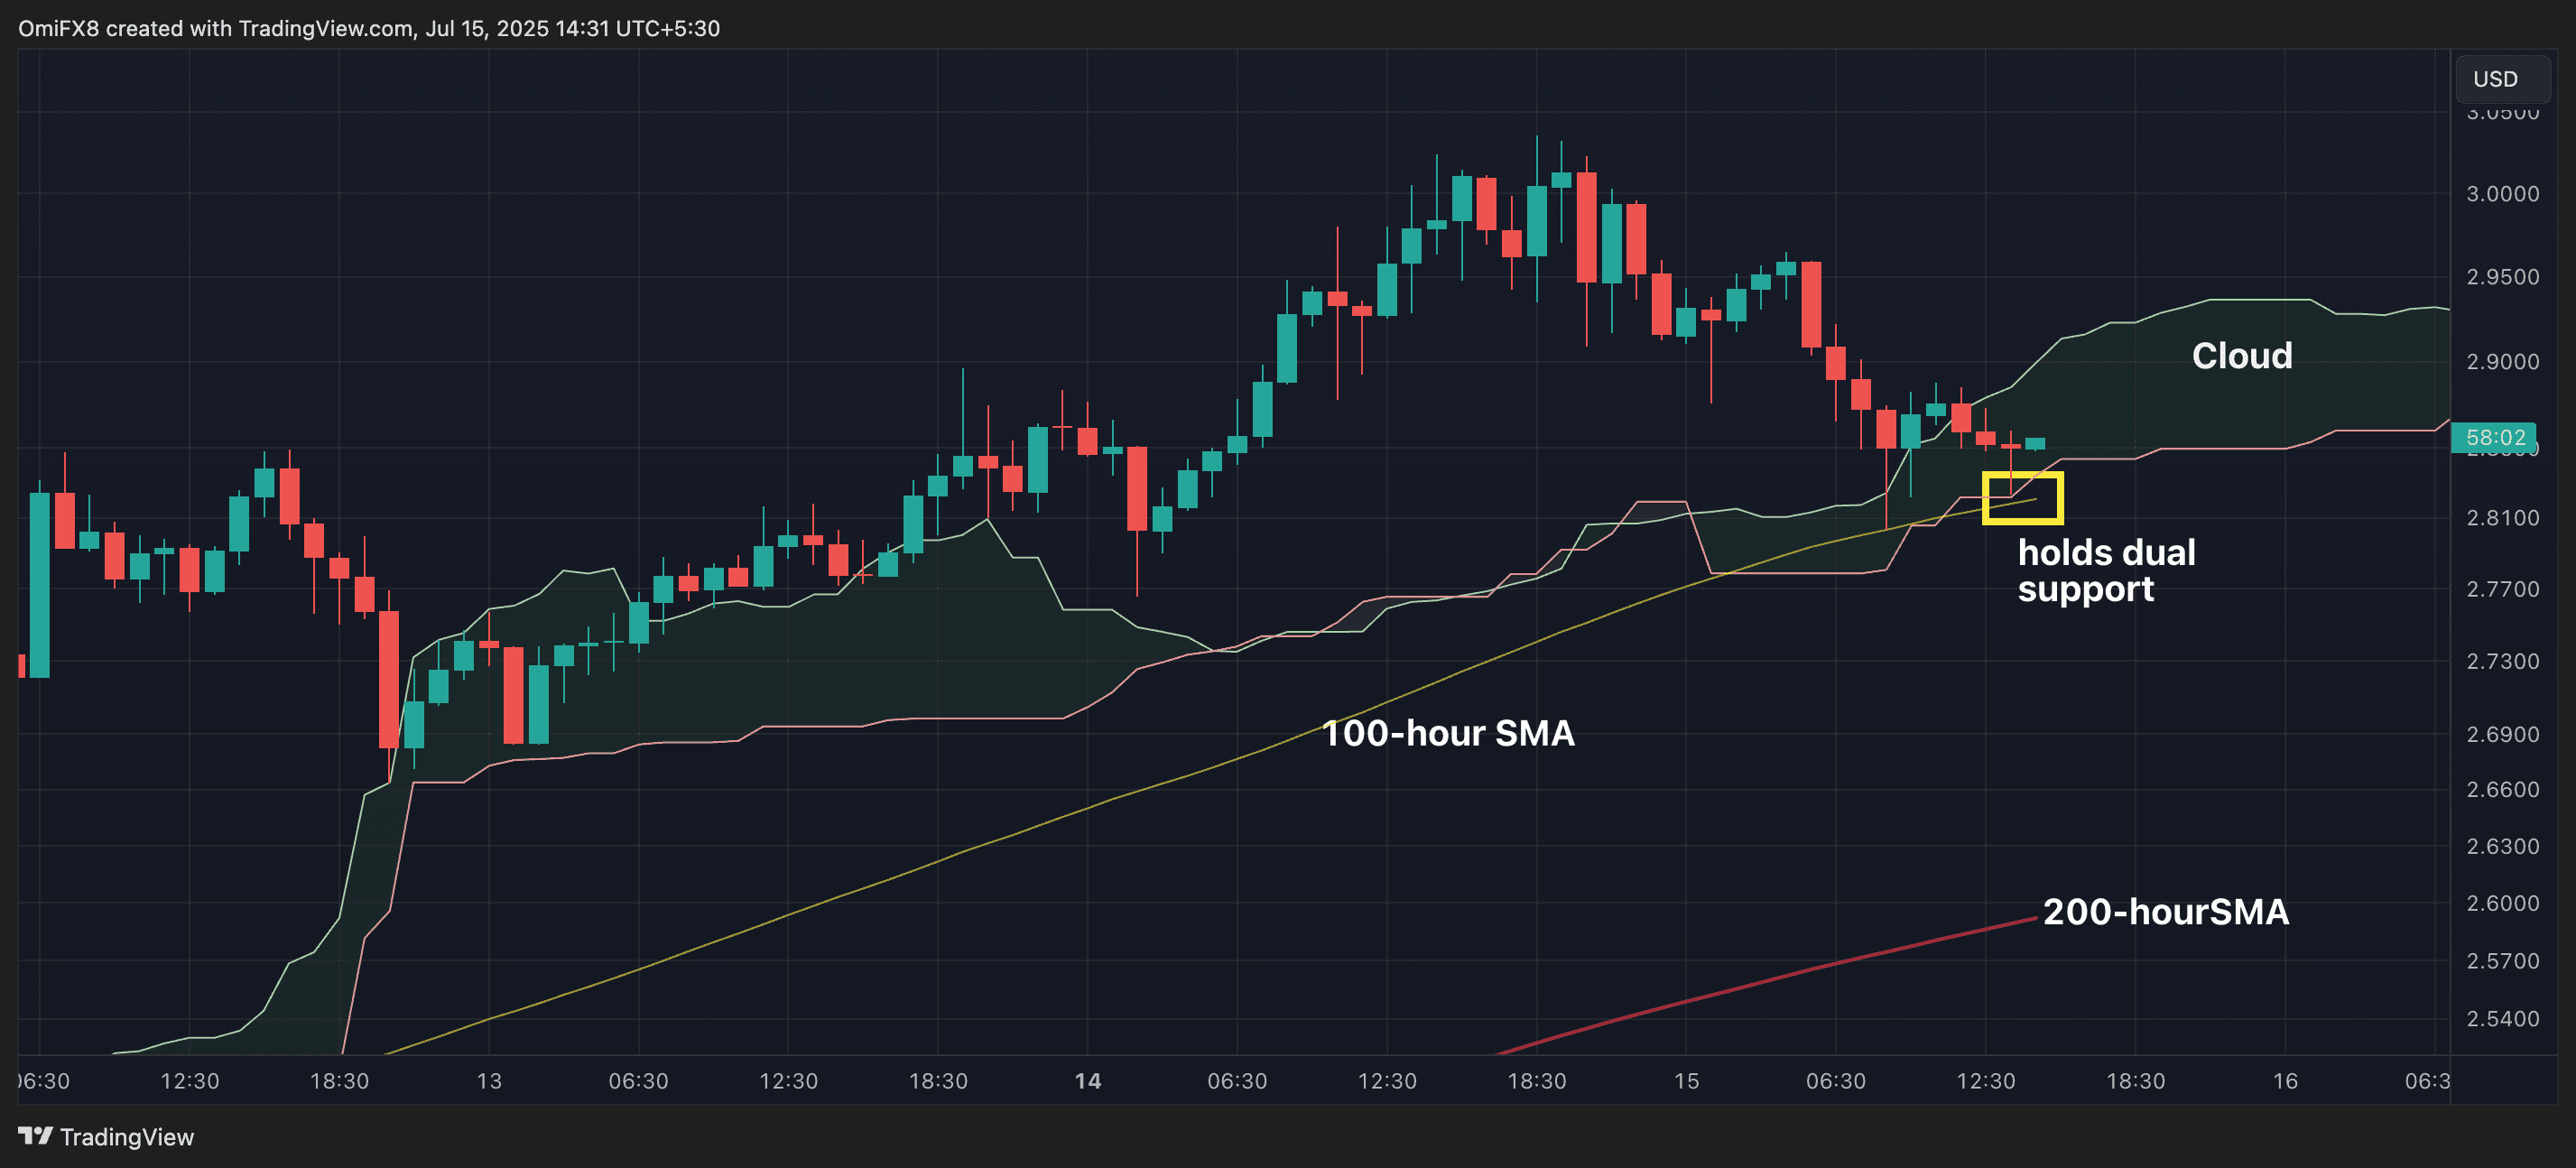
Watch out for the move below the Ichimoku cloud, as that would strengthen the immediate bear case, shifting focus to the 200-hour SMA at $2.6.
Again, volatility could be elevated with perpetual futures open interest hitting a record high of 2.74 billion XRP, according to Coinglass. The annualized XRP funding rates hover at 15%, indicating a growing bias for leveraged bullish plays.
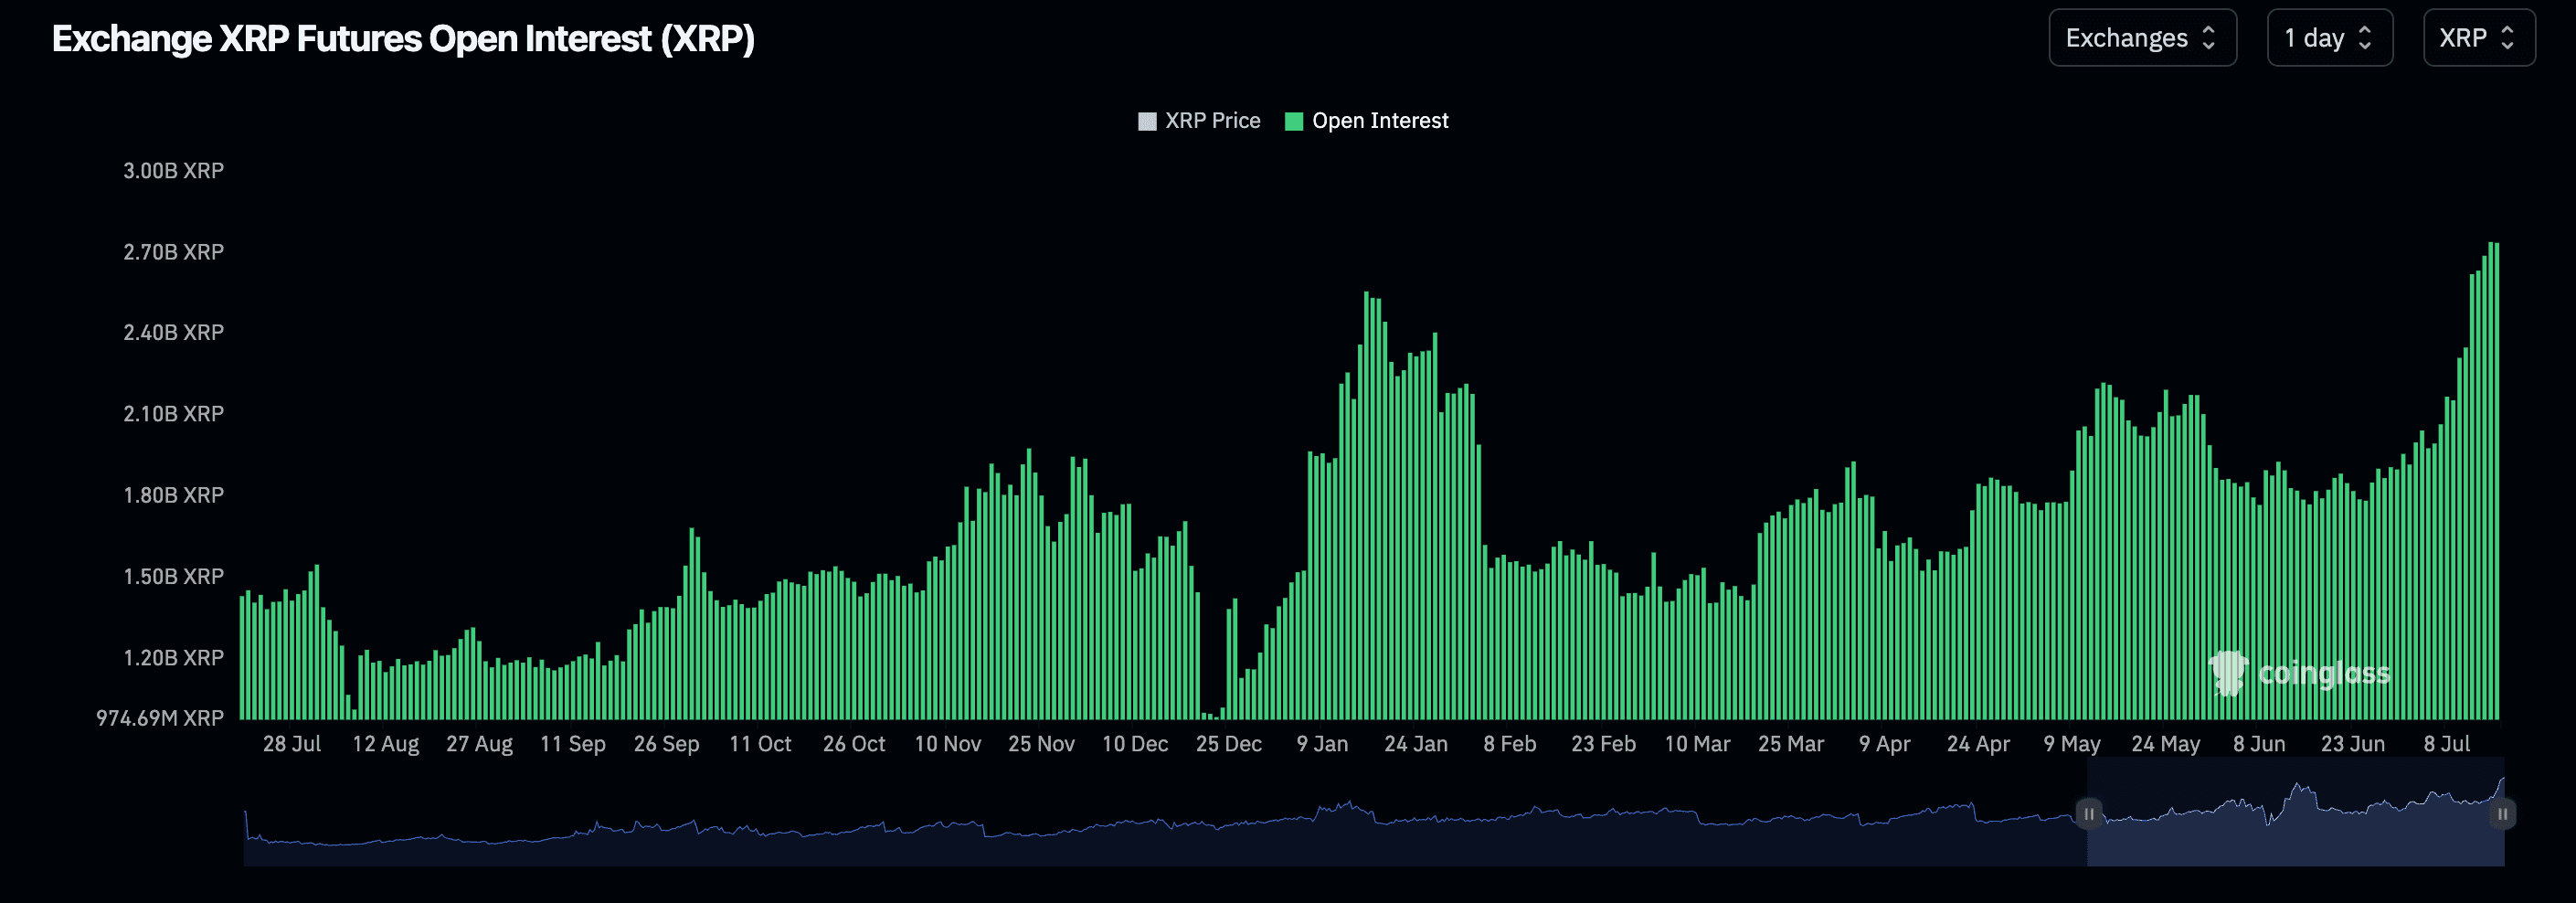
- AI’s take: Despite XRP’s hourly chart showing a BTC-mirroring downtrend from $3, its strong hold above the 100-hour SMA and Ichimoku cloud at $2.81 signals underlying support. Record perpetual futures open interest and high funding rates indicate significant leveraged bullish demand, making a breakout above $3, towards $3.4, likely if current support holds.
- Resistance: $3, $3.4
- Support: $2.81, $2.6-$2.65, $2.38
ETH: Awaiting breakout
Ether (ETH) remains trapped in an expanding triangle, with the daily stochastic flashing an overbought reading, pointing to stretched upward momentum, which weakens the case for a firm breakout in the short term. A consolidation around the resistance looks likely as prices are firmly above the Ichimoku cloud on the daily chart and short-term SMAs point north, indicating a bullish bias. An eventual breakout would shift focus to $3,400, a level targeted by options traders.
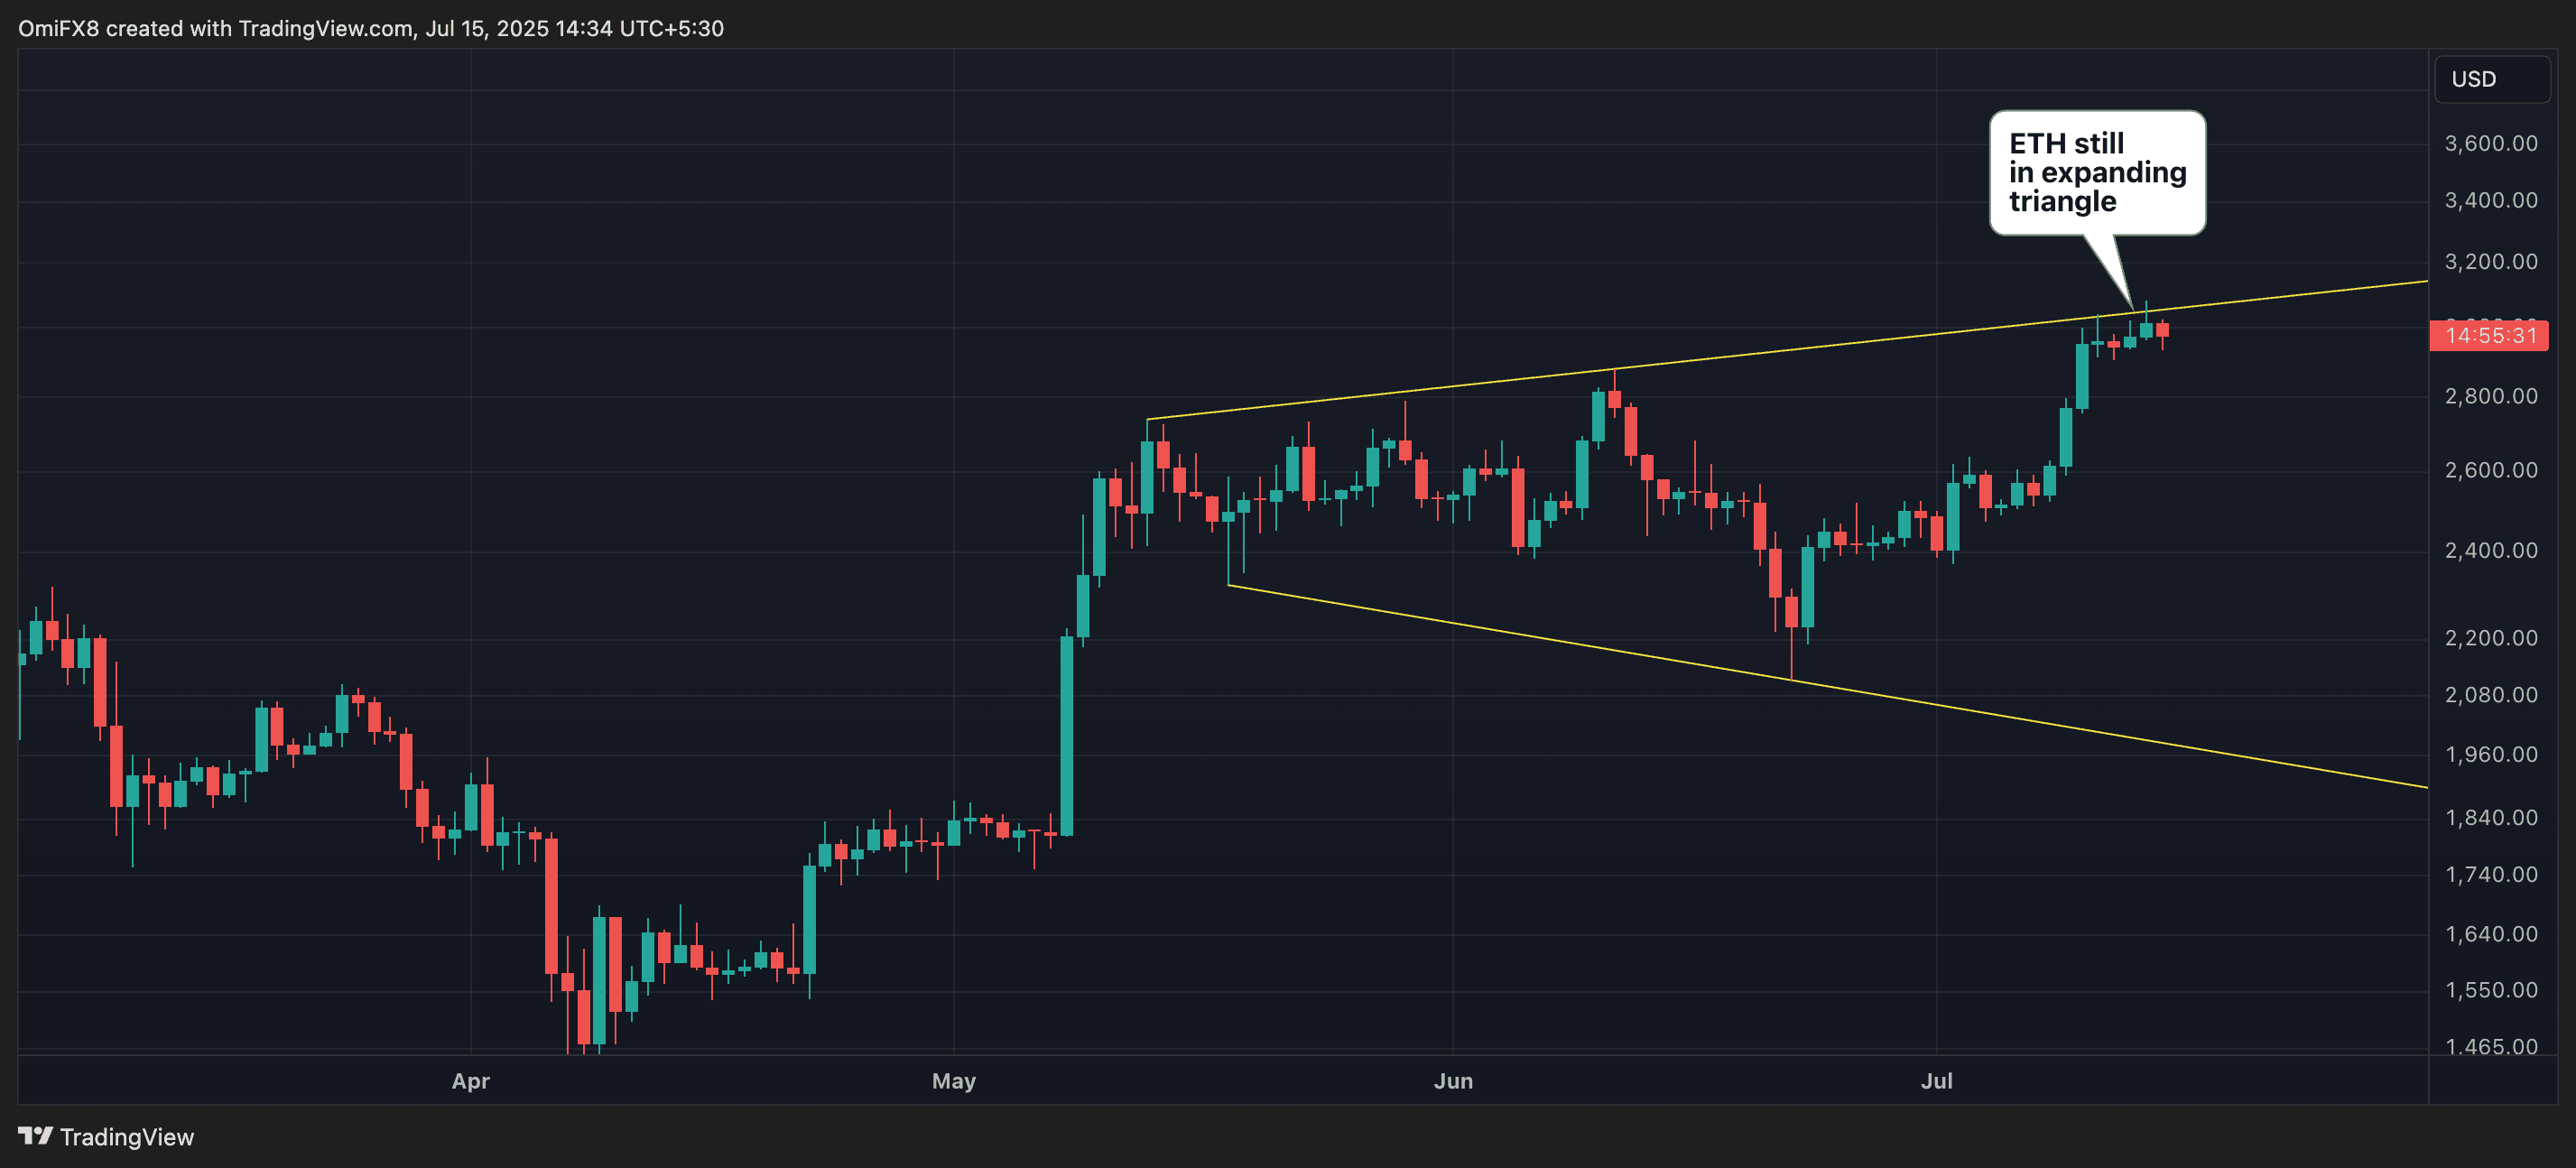
- AI’s take: The daily stochastic being overbought indicates that momentum is stretched, making a convincing push above the upper trendline unlikely in the short term.
- Resistance: $3,067 (the 61.8% Fib retracement), $3,500, $3,570, $4,000.
- Support: $2,905, $2,880, $2,739, $2,600
SOL: $168 is the new resistance level
SOL’s upside remains elusive despite the dual breakout on the daily chart. Since Friday, the bulls have failed at least twice to chew through bearish pressures at around $168, as evidenced by the long upper wicks attached to the candles for Monday and Friday. So, a break above $168 is now needed to confirm bullishness.
On the downside, $157 is the level to watch as it marks the neckline support of the double top pattern on the hourly chart. A breakdown of the support line would imply potential for a deeper decline to $146, per the measured move method.
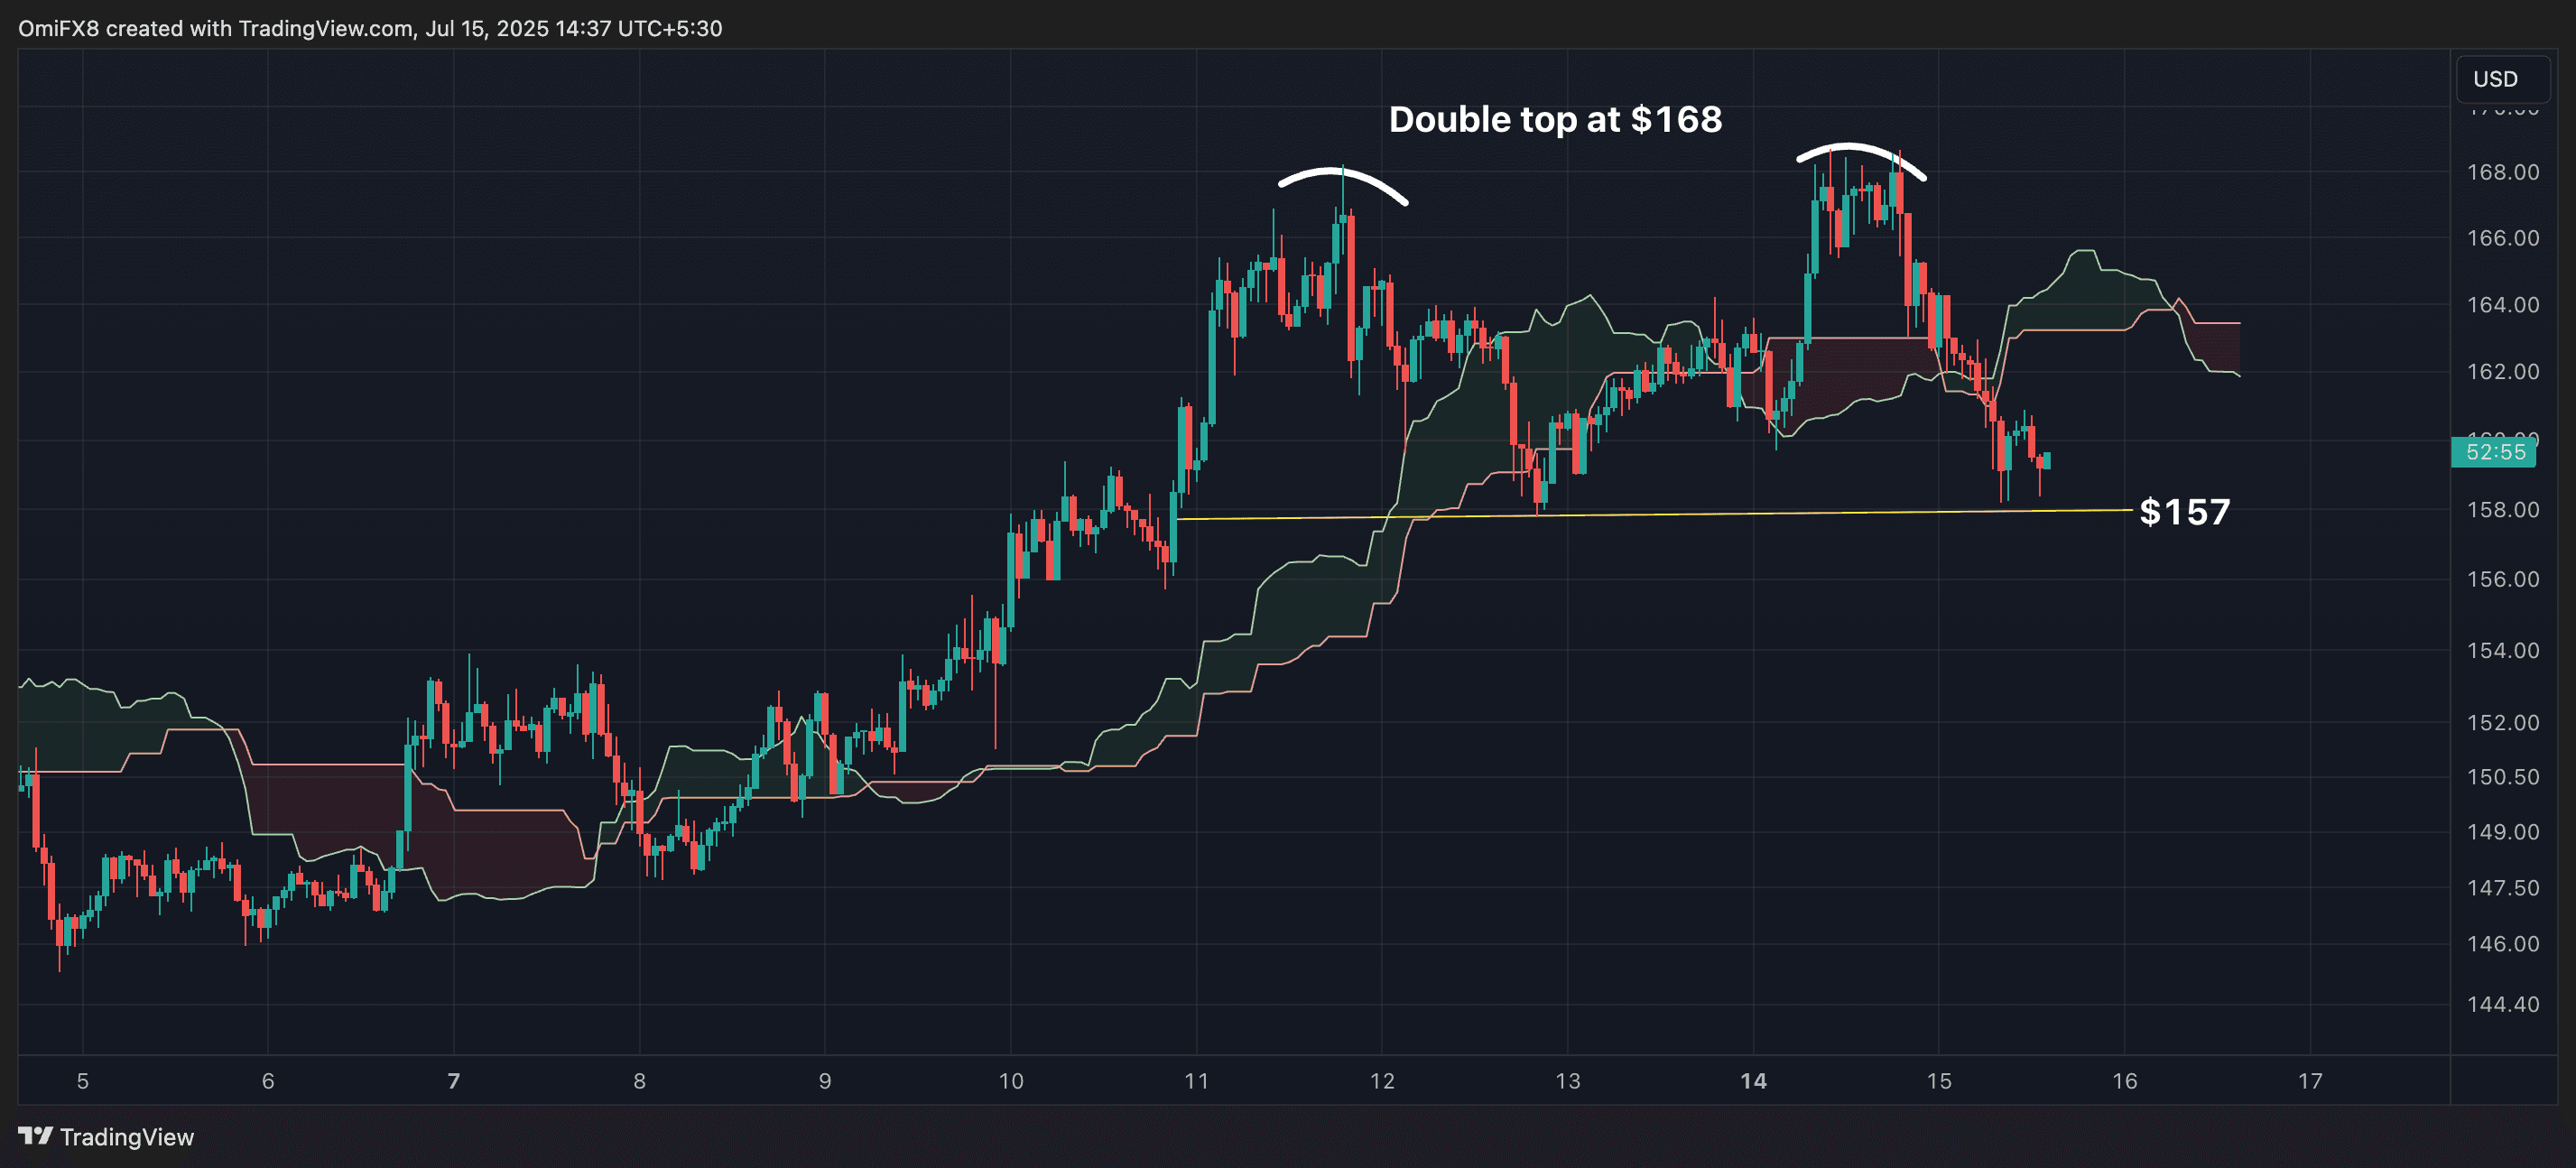
- AI’s take: Traders should watch for a definitive break above $168 to confirm bullish continuation; otherwise, a loss of the $157 neckline support could trigger a deeper decline towards $146.
- Resistance: $168, $180-$190, $200.
- Support: $157, $145, $125.


