With Bitcoin holding strong above $10,000, the halving in the past, and months of positive price action, it is hard to not be bullish on the first-ever cryptocurrency.
However, a momentum measuring tool has flipped bearish for the first time since April 2020 on weekly timeframes, potentially pointing to $10,000 failing to hold and a deeper correction ahead. Here’s what the technical analysis tool is saying and what has resulted from past bearish crossovers of the MACD.
What is The MACD And Why Is It Flipping Bearish Bad For Bitcoin?
The Moving Average Convergence Divergence indicator is a technical analysis tool used in Bitcoin price charting that serves a variety of functions.
The further the two moving averages diverge, the more overbought or oversold an asset is. When the two lines crossover, it can signal that momentum is turning either bullish or bearish.
In addition to the two moving averages, most MACD indicators feature a histogram to more clearly visually represent changes in momentum. The tool, while effective and extremely popular, is often regarded as a lagging indicator.
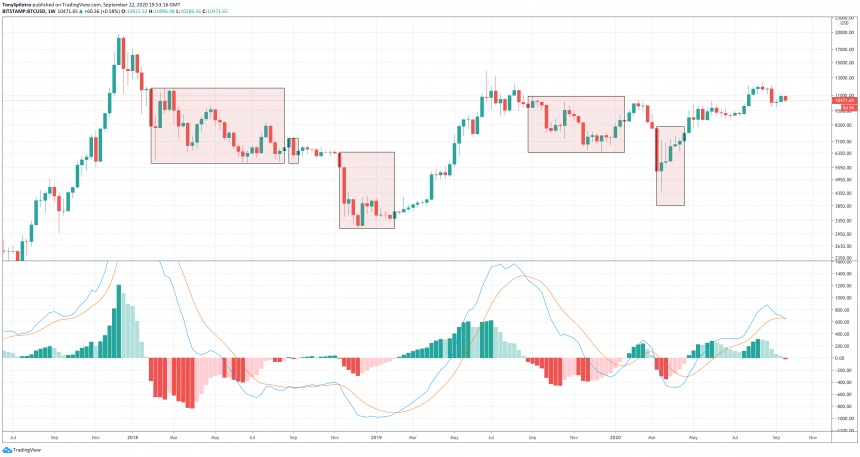
BTCUSD Weekly MACD Turns Bearish For First Time Since April | Source: TradingView
According to the tool on BTCUSD weekly price charts, Bitcoin momentum has just flipped bearish for the first time since the last week of April, just ahead of Bitcoin’s halving.
Related Reading | Beware: Bitcoin Price Action Mimics Market Maker Model
Halving hype and buying momentum while Bitcoin price was cheap from the Black Thursday selloff helped send the asset’s price skyrocketing from there. Momentum has been so powerful, the cryptocurrency has even broken above, and thus far held several retests of $10,000.
BTCUSD Weekly MACD Past Bearish Crossovers | Source: TradingView
Bull Trend In Jeopardy If Weekly Closes Bearish, Daily And Monthly To Follow
Because the MACD is a lagging indicator, there’s always a chance that the flip to red on the histogram is the result of the fall from $12,400 and the second, recent crash from $11,200. If that’s the case, the correction could be finished, and price and each moving average could soon turn backup.
But a turn right back up is rare and isn’t always positive. Looking back throughout the bear market when Bitcoin flipped bearish on the weekly MACD in the past, hasn’t been a sign that more bullish upside is ahead.
In fact, nearly each flip bearish has resulted in weeks of a downtrend. The only other instance where the weekly MACD flipped red temporarily before flipping back green, and that was just ahead of Bitcoin plummeting to its bear market bottom.
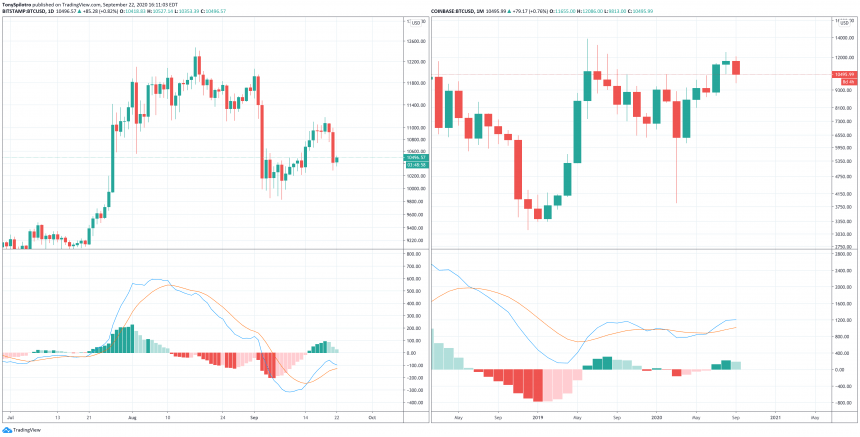
BTCUSD Daily and Monthly MACD Still Bullish, But Turning | Source: TradingView
Like with any indicator, signals vary across several different timeframes, and that’s further an issue for Bitcoin. On monthly timeframes, and daily timeframes, the MACD histogram is diminishing and the two moving averages are converging and looking poised for a bearish crossover.
A bear crossover across all three key timeframes could be especially bad for the crypto asset.
Related Reading | How BTC Held On Exchanges Matches Bitcoin’s Deadliest Drop Yet
The saving graces here for the cryptocurrency’s bull market is the fact that on daily and monthly timeframes, Bitcoin is still bullish, and the weekly must close for that red stain to be left behind on the asset’s price chart.
With the week almost half in the bag, the next few days are crucial for the bull trend to continue.


