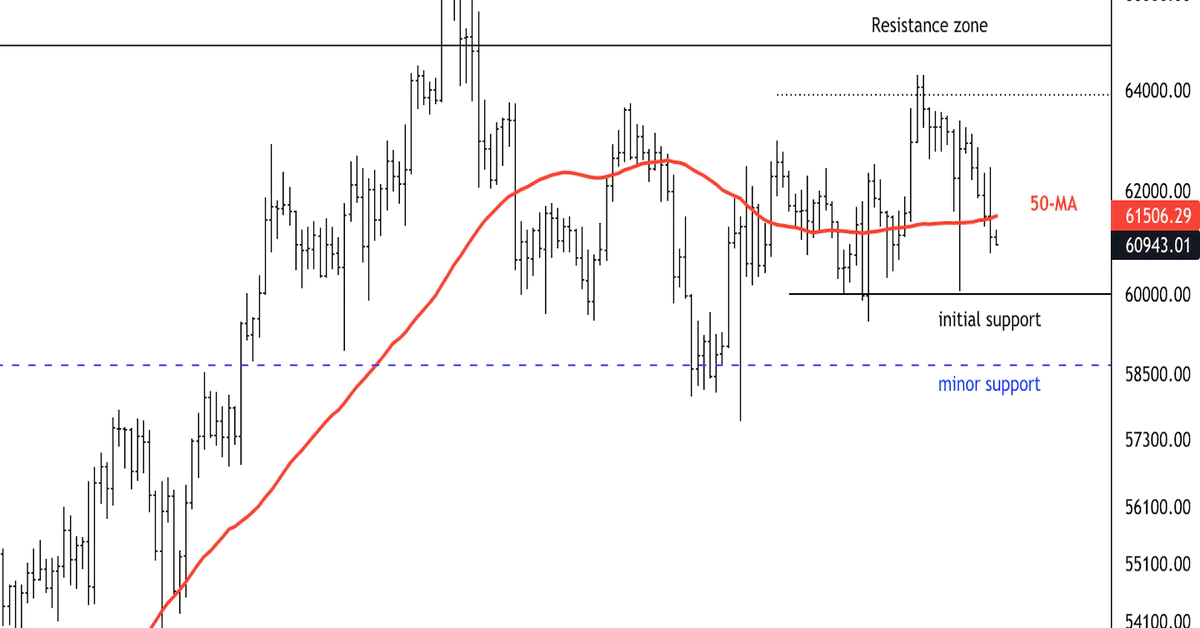
Bitcoin has traded in a tight range between $60,000 support and $64,000 resistance over the past week. Short-term buyers have been active on pullbacks, which suggests downside could be limited into Asian trading hours.
Upside momentum is slowing after BTC made an all-time high around $66,900 last month. It appears that buyers were quick to take profits around the price high, especially given short-term overbought signals on the charts.
BTC was trading around $61,500 at press time and is down about 1% over the past 24 hours.
The relative strength index (RSI) on the four-hour chart is not yet oversold, which suggests BTC could see further downside toward the $58,000-$60,000 support zone.
If buyers fail to hold $60,000, the next level of support is seen around $53,000-$54,000 (a near-10% decline from current levels), which is also at the 50-day moving average.
The weekly RSI is approaching overbought territory, similar to April and September, which preceded a downturn in BTC’s price. However, given a series of price breakouts over the past few weeks, BTC remains poised for a breakout above $60,000 based on positive historical returns in the fourth quarter.


