Bitcoin Price Zig-Zagging Between $8000 and $10000 As the Market Takes Profit
February 18, 2020 by Ramiro Burgos
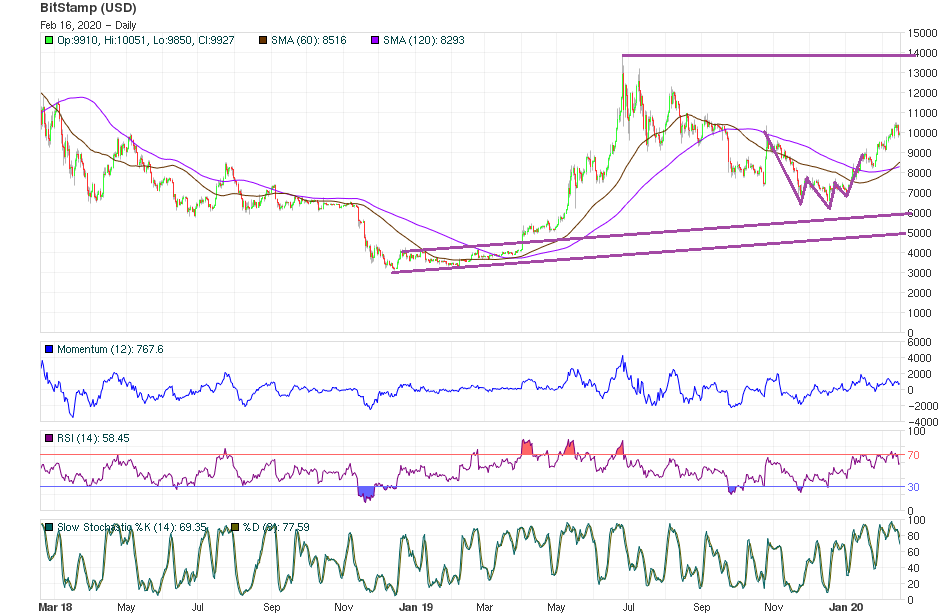
Bitcoin price and alt-coins have been in a sideways pattern this past week while the market takes profits. Intermediate support can be seen at $8000, setting a zig-zagging distribution area that could attract many new players to receive the profit-taking opportunities from old holders and winners.
Also Read: Text-My-Bits Wins Miami Hackathon Now Send Bitcoin Through SMS Text
Bitcoin Price Long Term Analysis
The fly in the ointment to quality and diversification is admitting cryptocurrency as a novel portfolio asset into the mainstream. The idea is being promoted in traditional mass media and especially through every social media network. This activity would extend the market population when and if institutional investors start offering it for Fintech in 2020. Doing so will help bitcoin and cryptocurrency win as an accepted investment alternative going hand in hand with the traditional marketplace.
The key to the market´s mood change should be measured by the Mass Psychology Analysis, monitoring the active Hope phase and its eventual change into Optimism. To consolidate at $10000 as a new lateral axis level, values would step back to $8500, helping the trend to gain strength by synchronizing prices with all development theories.
Mid Term Analysis
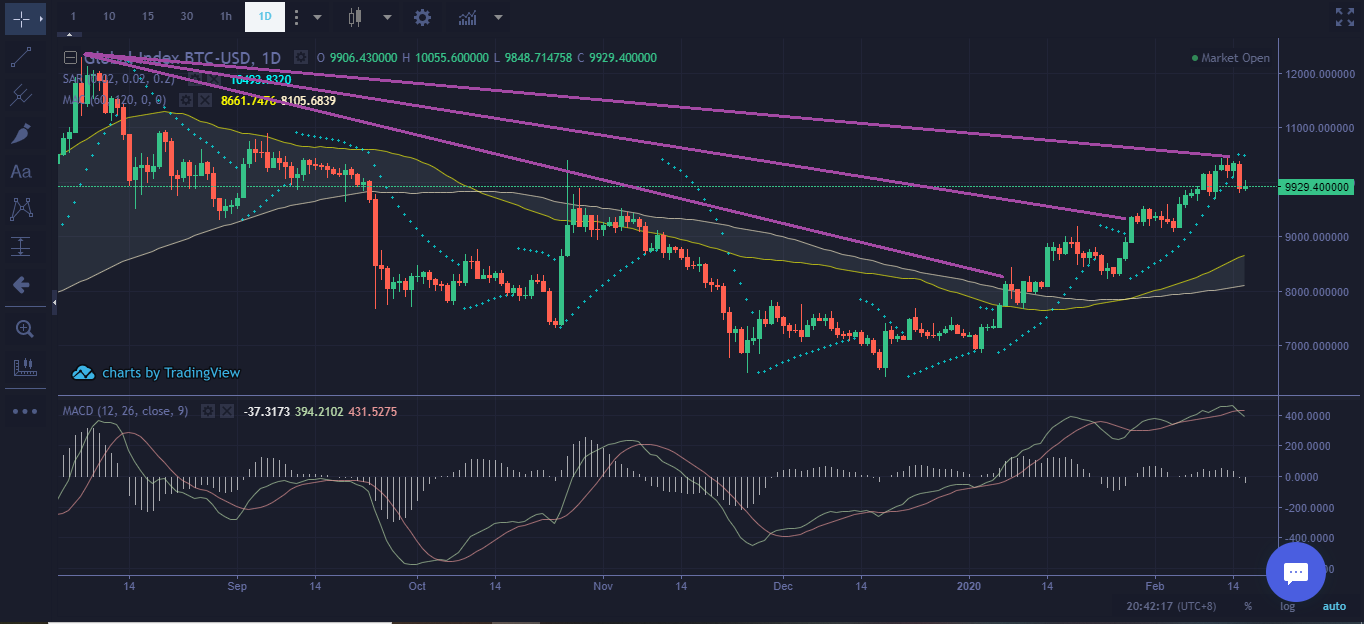
A bullish scenario was confirmed except market quotes can´t get enough momentum to go higher alone. They could step back below the current level until technical indicators swing down to their bottom limits driving the prices to $8000. Then they could return up to prices by synchronization across the distribution area. Then take the action beyond $10000 in a future stage.
As seen on the chart, every rise attempt faces a hard distribution of activity that harms the trend´s strength. Thus favoring a bearish correction or a lateral market. Only big news and external factors contribute to sustaining the trend if and when they are positive, generating a lateral market.
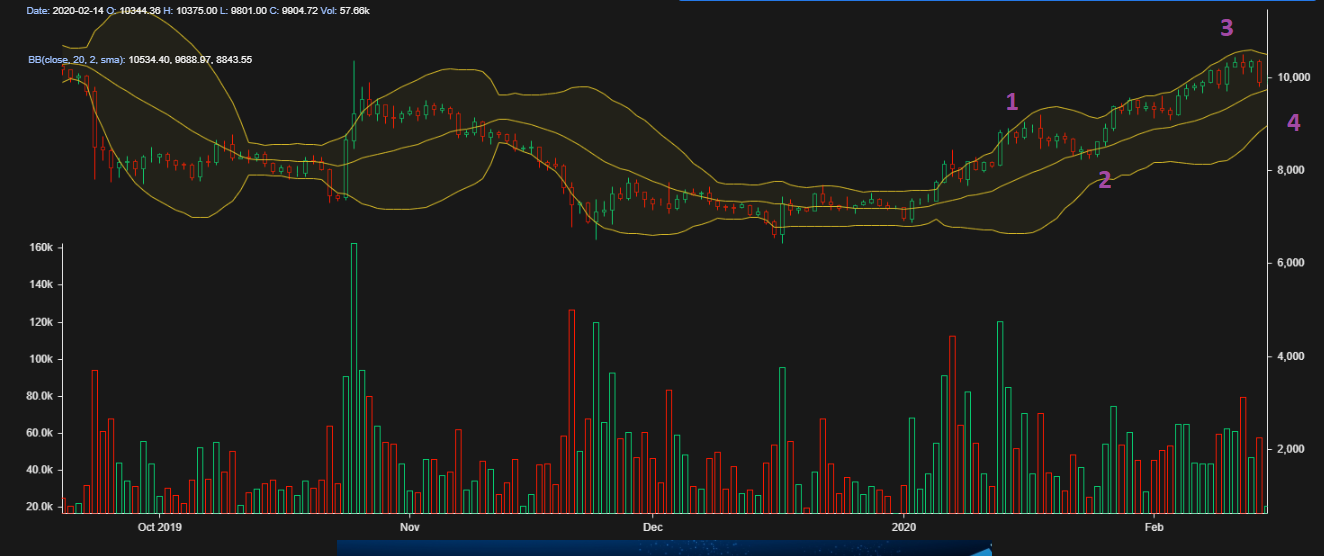
The Fibonacci Fan Lines were activated, boosting the bitcoin price to follow Elliott´s 5 Waves theory. Thus bringing the quotes as a shield when entered to the Japanese Candlestick imaginary battlefield fairy example. The current stage is controlled by the distribution of Crows, but demand soldiers did it well enough to prevail when they clashed on the offer three weeks ago. The Crows have been reordered taking hold at $10000. They seem to be ready and strong enough to ensure the corrective 4th Elliot´s back movement, sending the soldiers to $8500. If this action continues, demand could sustain a lateral market while waiting on mathematical indicators to reinforce the trend and strike back.
What do you think will happen to the bitcoin price? Share your predictions in the comments below.
If you find Ramiro’s analyses interesting or helpful, you can find out more about how he comes to his conclusions by checking out his primer book, the Manual de Análisis Técnico Aplicado a los Mercados Bursátiles. The text covers the whole range of technical analysis concepts, from introductory to advanced and everything in between. To order, send an email to [email protected]
Images via Pixabay, Ramiro Burgos
This technical analysis is meant for informational purposes only. Bitsonline is not responsible for any gains or losses incurred while trading bitcoin.


