Less than 24-hours ago Bitcoin (BTC) price dropped to a two week low at $6,468, inciting calls for a revisit to the sub-$6K zone but the digital asset deftly shook off the bears by reversing course to rally to $7,190.
At the time of writing the Bitcoin trades slightly above $7,100. As one would expect, altcoins followed the drop in Bitcoin price but as it recovered a number of top altcoins also bounced strongly. Ether (ETH) managed a 17.77% gain, while Binance Coin (BNB), and Chainlink (LINK) surged by 11.65% and 15.02% respectively.
Crypto market daily performance. Source: Coin360
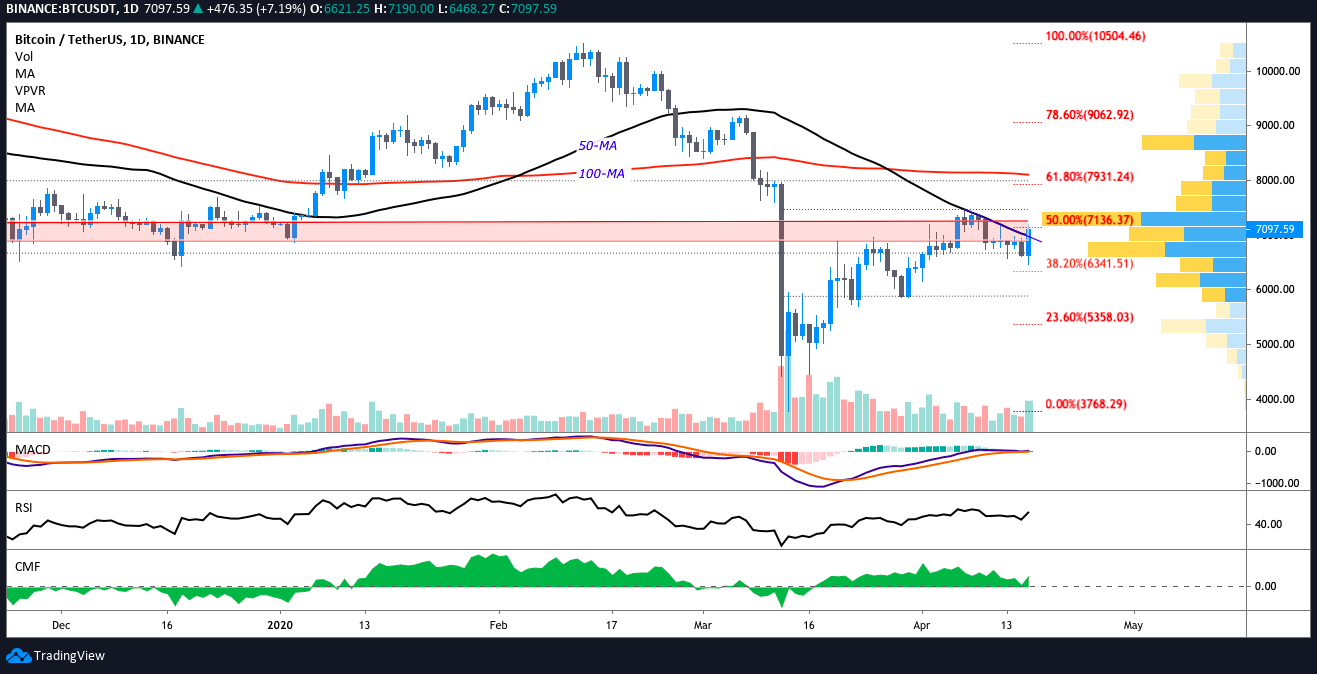
Bitcoin’s 10% surge pushed the price above the 50-MA which had been serving as resistance for the past 9 days and a close above this level is crucial or the price can slip back below $6,900 to return to the range of the previous week.
Previous analysis focused on the need for Bitcoin to flip $6,900 to support and also the importance of clearing the resistance cluster (pink) from $6,886-$7,250. Today’s move to $7,190 has ticked one of the two boxes but at the time of writing the price is still touseling with the 50% Fibonacci retracement at $7,136.
As things currently stand a close above the 50-MA (descending trendline) would be acceptable progress.
BTC USDT daily chart. Source: TradingView
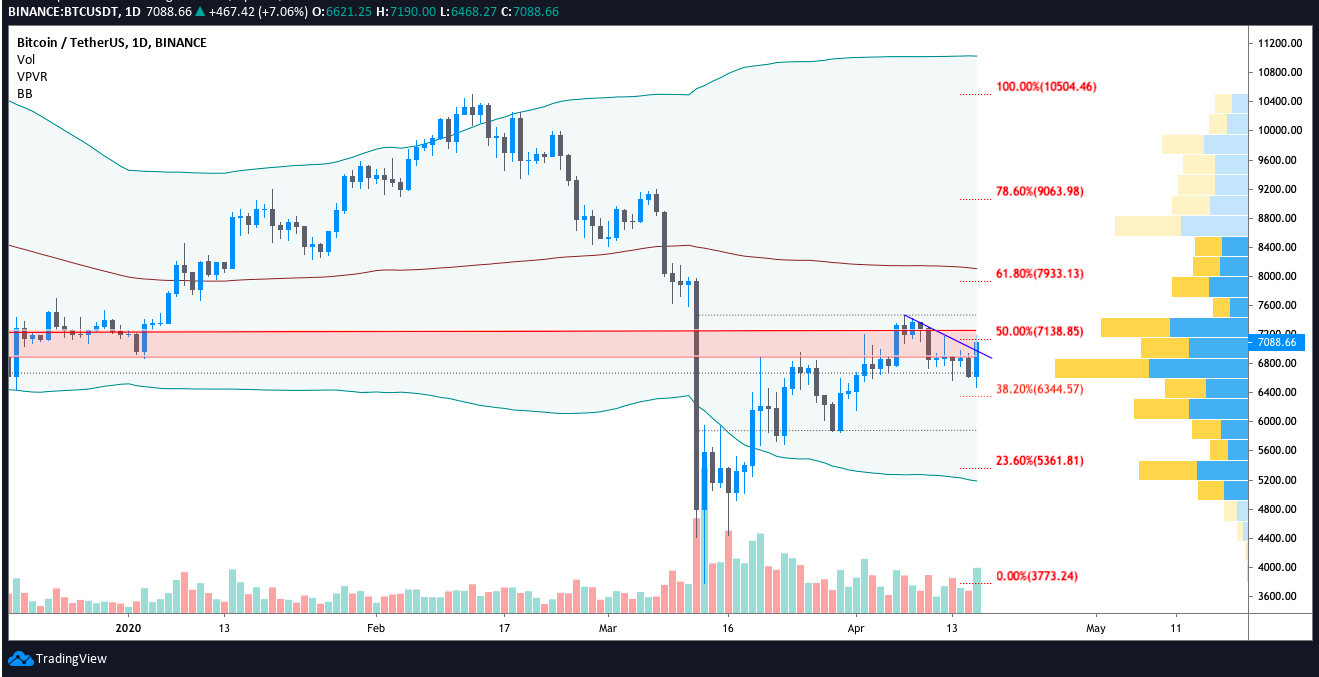
An even better outcome would entail Bitcoin price pushing above the 50% Fib retracement to $7,250 but in addition to the 50% Fib level being resistance, there is a high volume VPVR node right at $7,200. If bulls can push the price through this node ($7,200-$7,400) a run up to the 100-day moving average at $8,100 seems probable.
BTC USDT daily chart. Source: TradingView
The Bollinger Band moving average is also lined up with $8,100 and both it and the 100-MA are slightly above the 61.8% Fib level at $7,931 so many analysts have called for a rejection at the 100 and 200-day moving average.
BTC USDT MACD daily timeframe. Source: TradingView
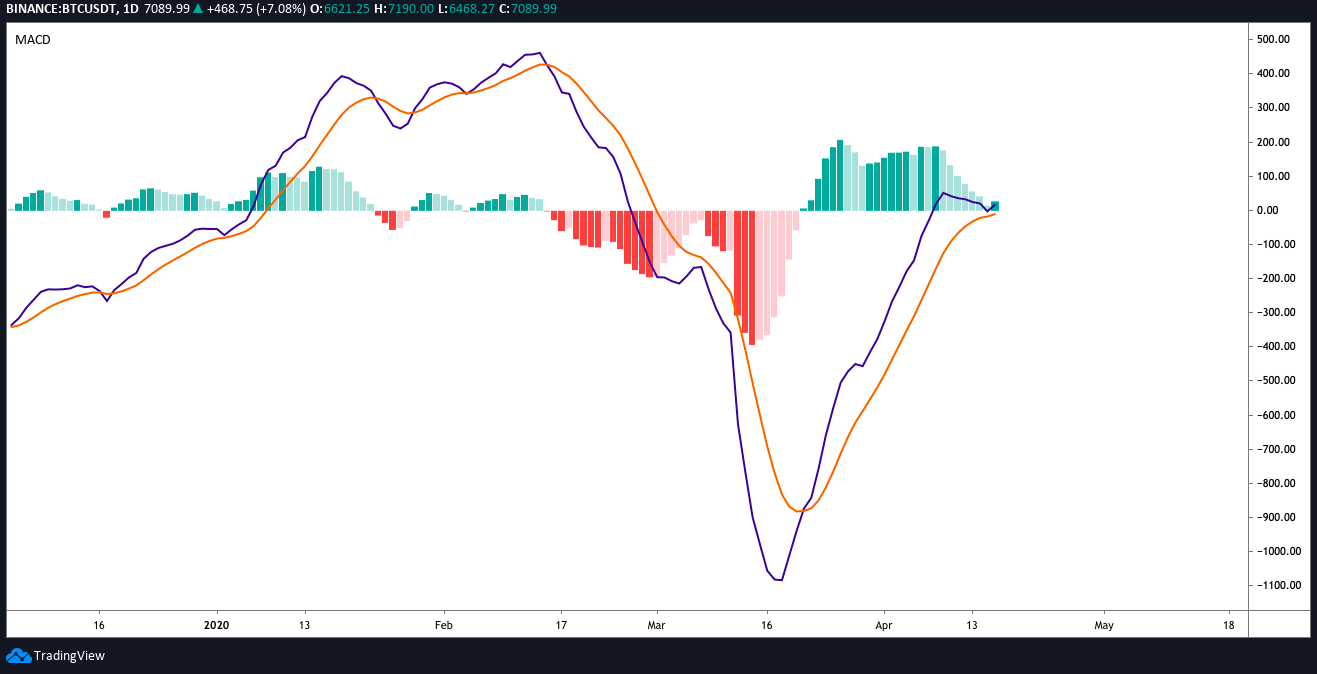
On the daily timeframe the moving average convergence divergence has avoided a bear cross as the MACD has pulled sharply away from the signal line and the histogram flipped above 0 with a dark green bar.
BTC USDT RSI & CMF daily timeframe. Source: TradingView
The RSI has also taken an encouraging turn, moving from 45 to 55 at the time of writing. The Chaikin Money Flow has also pulled above 0 and buy volume on the daily timeframe is the highest it’s been since April 2.
A bearish outcome would take place if Bitcoin price pulled back to close below the 50-MA or the $6,900 support.
The views and opinions expressed here are solely those of the author and do not necessarily reflect the views of Cointelegraph. Every investment and trading move involves risk. You should conduct your own research when making a decision.


