Bitcoin Price: Is $8K the New Normal or Can it Bounce Back?
October 13, 2019 by Ramiro Burgos
The bitcoin price is now balancing around $8,000 USD, potentially favoring a chance to revert and upgrade to the former lateral market, somewhere around the $10,000 axis level. How do the charts look this week? Read our weekly technical analysis to find out.
Also read: Bitcoin Price Finally Moves, but Not How You Wanted. What’s Next?
Subscribe to the Bitsonline YouTube channel for great videos featuring industry insiders & experts
Bitcoin Price Technical Analysis
Long-Term Analysis
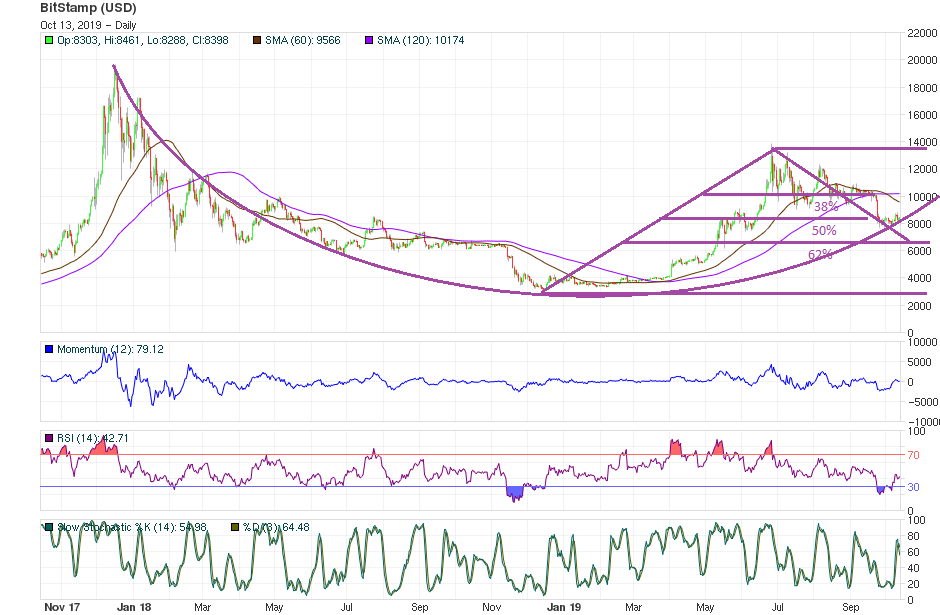
After four months of a lateral market at 38 percent Fibonacci Retracement Numbers Theory range near $10,000, the bitcoin price slipped back to the following 50 percent with the same theoretical criteria. Here, it met a rounded bottom long-term formation curve mark near $7,500.
The trend re-balanced offer and demand at the $8,000 level, staying out of further crack danger by keeping the lateral market active, now backed on Bullish Consensus again — but depending on News, Fundamentals and political factors.
The action headed to a reversal upward, increasing volatility, which expanded the former 3,000 basis point swinging range to 4,000, and activated a bullish target near $11,000 — with a psychological trigger if and when quotes overcome recent $9,000 broken support.
Mid-Term Analysis
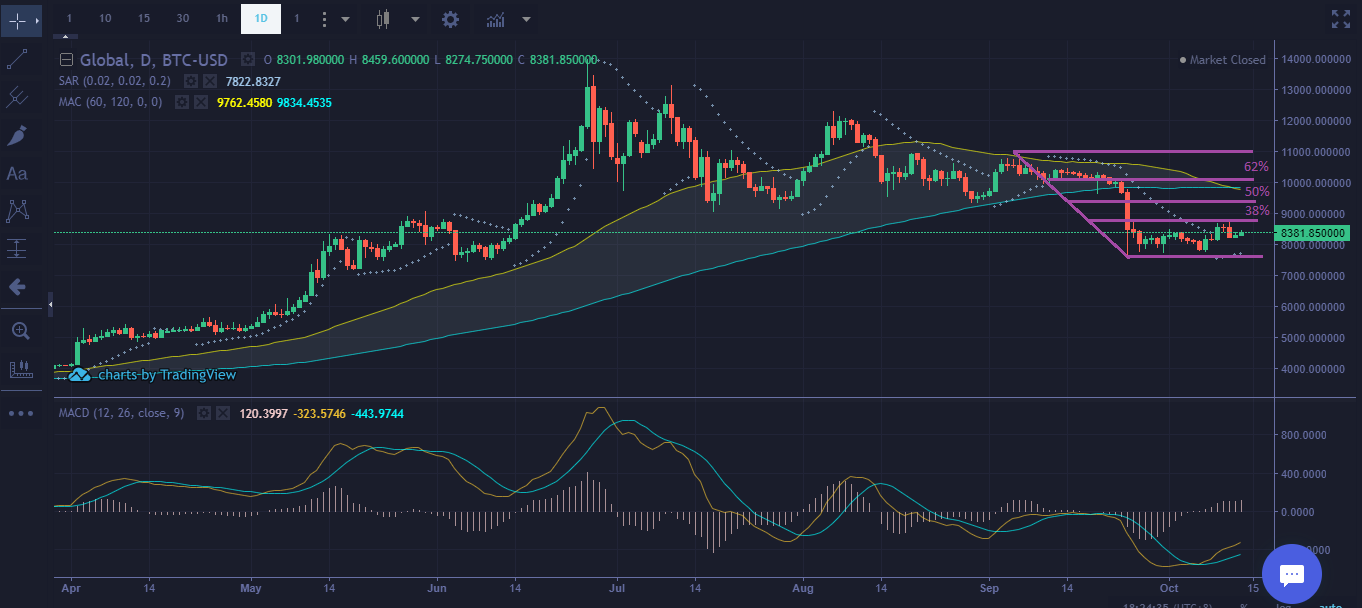
The trendline synchronized itself with mathematical indicators and re-framed into Fibonacci Retracement Theory, which allowed a sub-scoping consideration from the last weeks into the main monthly movement.
With the active sideways movement values still out of the bearish channel influence, they could start an upward recovery to the $10,000 axis level from where they dropped… if and when prices overcome the $9,000’s level resistance.
On the other hand, if prices stay below $9,000 too long, a support at $6,000 should be re-considered as a new 3,000 basis point scenario.
Short-Term Analysis
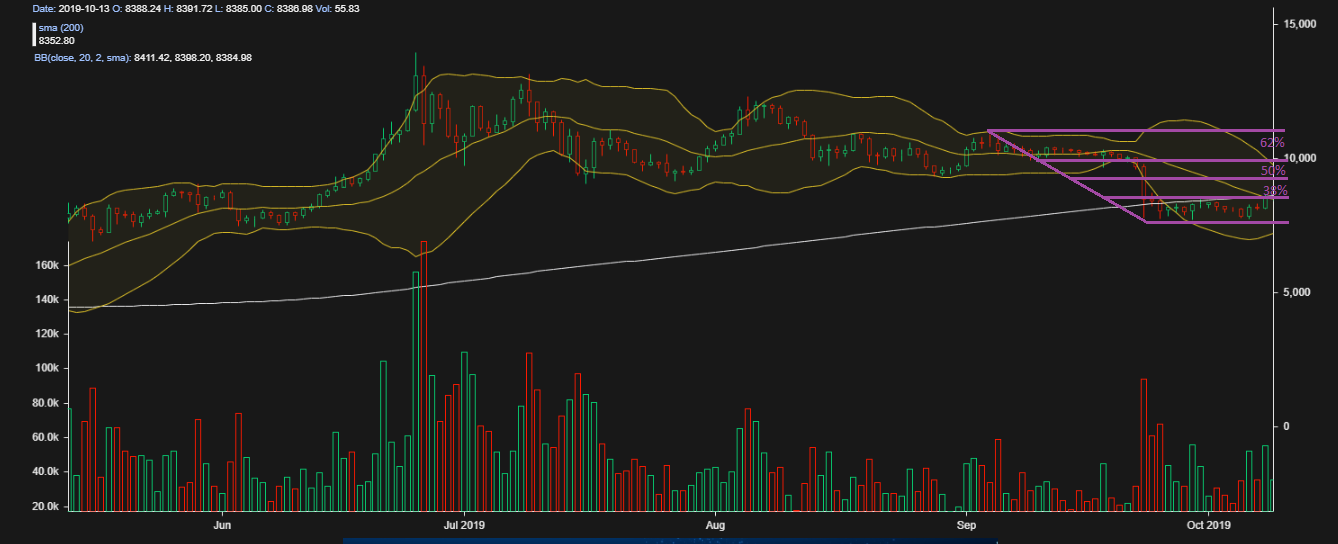
Japanese Candlestick images reflect that Demand’s soldiers are strong enough to defend the current $8,000 level, and even to re-enter into their former battlefield above, between $9,000 and $12,000.
Mathematical indicators are reinforcing a reversal movement since turning to the up side while volatility remains high. This could swing the quotes up and down, keeping the trend into a bullish frame.
The psychological trigger seems to be $9,000, but if that level becomes a resistance, the same 3,000 basis point battlefield could slip down, re-activating a support level at $6,000.
What do you think will happen to the bitcoin price? Share your predictions in the comments below.
If you find Ramiro’s analyses interesting or helpful, you can find out more about how he comes to his conclusions by checking out his primer book, the Manual de Análisis Técnico Aplicado a los Mercados Bursátiles. The text covers the whole range of technical analysis concepts, from introductory to advanced and everything in between. To order, send an email to [email protected]
Images via Pixabay, Ramiro Burgos
This technical analysis is meant for informational purposes only. Bitsonline is not responsible for any gains or losses incurred while trading bitcoin.


