On May 5, Bitcoin (BTC) price recovered a significant portion of its losses from Sunday’s weekly close correction and data from Cryptox Markets and CoinMarketCap shows that within the last hour the digital asset crossed above the $9K mark again.
Despite correcting to $8,500 on Sunday, Bitcoin price quickly rebounded and found support in the $8,700-$8,850 range before spending the majority of Monday consolidating in this zone.
Crypto market daily price chart. Source: Coin360
Interestingly, Bitcoin’s quick recovery to its previous trading range occurs as modeling from the United States Center for Disease Control and Prevention expects that a rising rate of COVID-19 infections will lead to 134,000 deaths in the U.S. by June 1. This comes as many states execute plans that allow people to return to work in an effort to revive the economy.
Further bearish news for markets came at the market close today when The Treasury Department announced that it plans to borrow $3 trillion this quarter, bringing the total U.S debt closer to $25 trillion.
Currently, more than 30 million Americans have filed for unemployment, and a government-supported program designed to provide financial assistance to small businesses expended all allocated funds within the first few days of rolling out.
Given the recent correlation between traditional and crypto-markets, all of these factors should negatively impact crypto prices but at the moment this is clearly not the case with Bitcoin.
Bitcoin bulls target $9,500
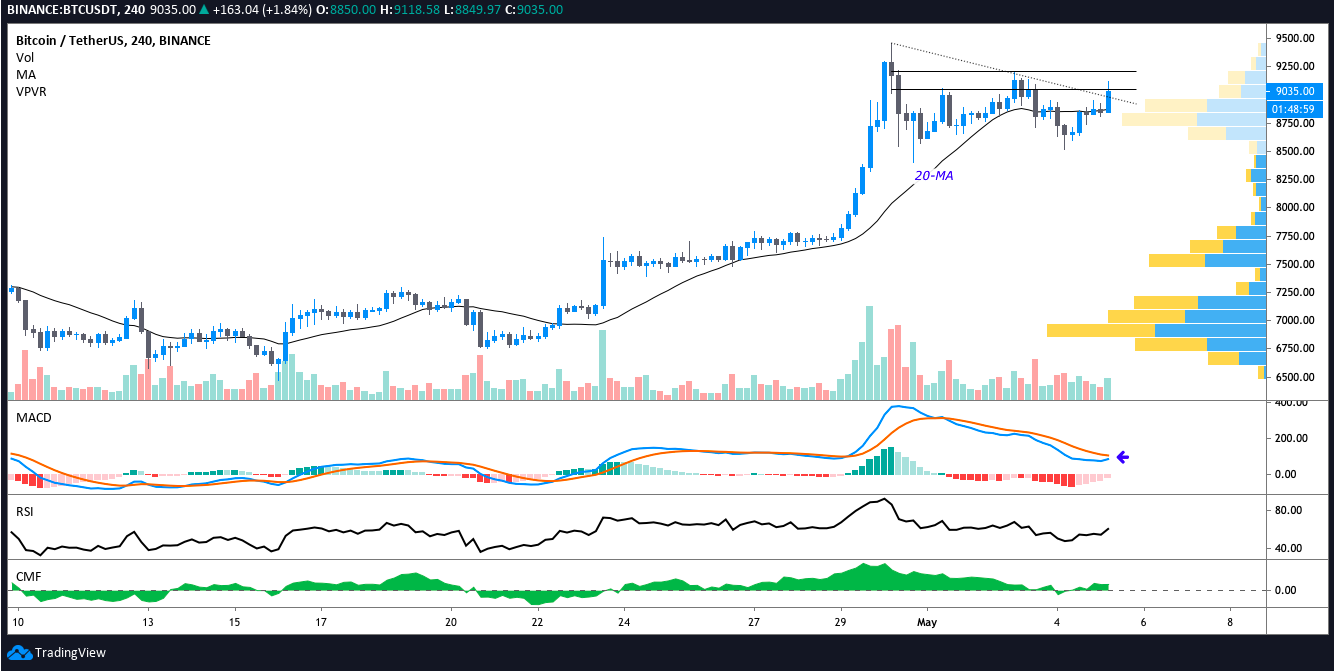
In the 4-hour timeframe, traders will notice that Bitcoin had been in a day-long struggle to maintain above the 20-MA and the price was pinched between the $8,700-$8,550 where there are two high volume nodes on the volume profile visible range.
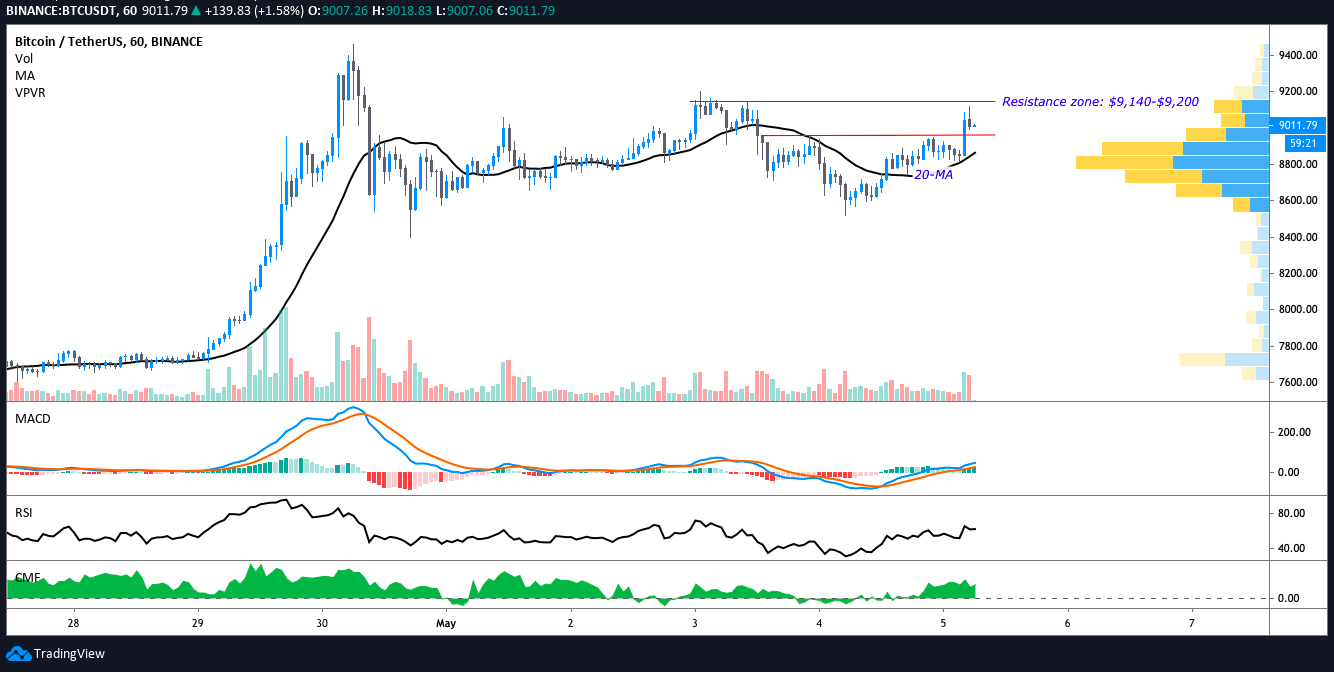
The hourly time frame shows that the price had already rejected three times at $8,950 and a move above $8,970 was crucial for gains above $9,000.
Within the last hour, BTC/USD broke above this resistance, allowing the price to rise to $9,100 in an attempt to knock out resistance at $9,130. Above $9,140 traders will target $9,440 and $9,600.
BTC USDT 1-hour chart. Source: TradingView
The 4-hr chart also shows that the MACD is on the verge of converging with the signal line, and over the past 8 hours, the RSI has shifted from 47 into bullish territory at 60.
On the hourly chart, traders will note that profit-taking is occurring as demonstrated by the long upper wicks of the last two candles, along with the rise in selling volume, sloping RSI and CMF.
BTC USDT 1-hour chart. Source: TradingView
As the current 1-hour candle is on the verge of closing, traders should keep an eye on volume to see if momentum wanes and the price drops below $9,000 or whether Bitcoin price can push above the resistance zone from $9,140-$9,200.
As stated in multiple analyses, the key area to break for a continuation of the uptrend is $9,500-$9,600.
The views and opinions expressed here are solely those of the author and do not necessarily reflect the views of Cryptox. Every investment and trading move involves risk. You should conduct your own research when making a decision.


