It’s not uncommon for technical crypto analysts to compare Bitcoin price charts with that of other assets hoping to draw some comparisons that an actionable strategy can be derived from.
The leading crypto asset by market cap has been closely following the price action of early Nokia stocks, and if Bitcoin continues to follow the pattern closely, a bounce is due in the near term.
Bitcoin Price Ready to Bounce If Nokia Curse Fractal Is Followed
In recent weeks, analysts trying to find meaningful comparisons to Bitcoin price charts have looked to everything from post-dot com bubble Amazon, to avocados, and now, the original iconic cell phone Nokia.
Related Reading | Emotional Rollercoaster: Bitcoin Could Follow the Amazon Fractal, Big Upside Potential
The stock price of early mainstream cell phone manufacturer Nokia Corporation went parabolic, and formed a blow-off top peak much like Bitcoin did during the 2017 hype bubble, where the crypto asset had a highly-publicized meteoric rise that took its price to $20,000 and made the asset a household name, just like Nokia.
But after that peak, Nokia – like Bitcoin – plummeted and set a low far deeper than the parabolic top, before rising once again. After that bottom, the asset formed an echo-bubble much like Bitcoin has formed during 2019 – essentially a miniature fractal of the former bubble with price action that mimics the original.
Just like the larger, parabolic top, Nokia’s stock price tanked once again, before setting a new, lower bottom later down the line.
If Bitcoin price does continue to follow Nokia’s stock price so perfectly, it could suggest a bounce is very near. Upon zooming in on Nokia’s price chart, after setting a new lower low, the asset briefly rises once again, marking a bearish retest of former support turned resistance before turning back down and falling much deeper to its eventual bottom.
BTC/Nokia Curse💀update: Zoomed in on the weekly, 2nd ‘peak’ of Nokia before the descent. BTC right on schedule; had a similar massive dead cat bounce into resistance, and full retrace. What next? According to the chart, a nice little pump, before continuation down 🤣 pic.twitter.com/RHF8AE92wf
— Rebecca Lee (@rlee7995) November 22, 2019
Should the same price action play out in Bitcoin price charts, the crypto asset should bounce here and make a run once again for above $8,000, before failing to break back above into bullish territory and suffers a deep collapse soon after.
Cell Phone Memes, and Crypto Chart Comparisons
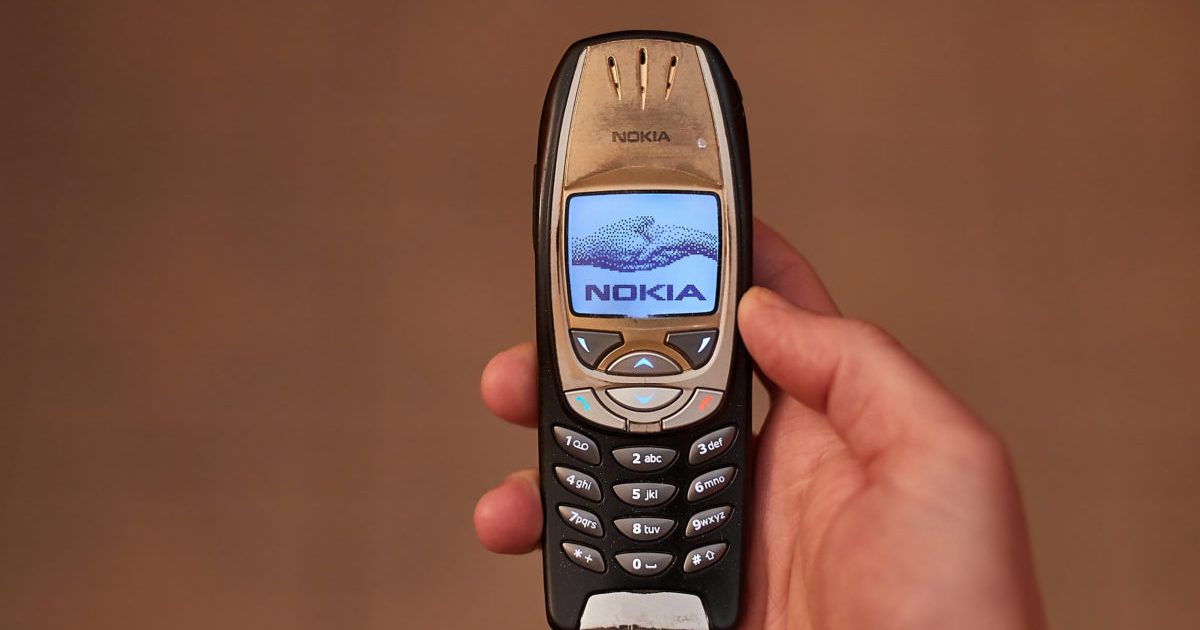
At one point, Nokia was a new, emerging technology, much like Bitcoin, but once newer, and better technology emerged, the stock price never again returned to such highs, and the cell phone itself has become a meme known for its dangerous drops – also much like Bitcoin.
Related Reading | Bitcoin Correlated With Avocado Toast, Is Crypto Another Millennial Luxury?
Given the size and weight of Nokia phones, the internet is flooded with memes showing what happens when a Nokia device is dropped from a distance, leaving a crater in its wake. Bitcoin price drops are just as dramatic, causing billions to disappear from its market cap in a matter of minutes at times.
However, the comparison between the two assets stops there, as the price chart fractal is likely nothing more than a coincidence, much like avocados, Amazon, and others that have been compared to Bitcoin in the past.


