On April 11, Bitcoin (BTC) dropped to $40,500, reaching a crucial level that erased the gains from the previous three weeks when the price peaked at $48,200 on March 28.
According to analysts, the United States Federal Reserve balance sheet reductions are adding pressure to stocks and risk assets, with Bitcoin standing to lose appeal.
Decentrader co-founder filbfilb agreed with these powerful headwinds by arguing that the Fed’s action could influence the BTC price trend “for months to come.”
Bitcoin reacted unfavorably to a resurgent dollar, with the U.S. dollar currency index (DXY) returning above 100 for the first time since May 2020. While some consider the DXY event a temporary show of strength, its impact on crypto markets was clear.
Data shows margin traders are bullish
Margin trading allows investors to borrow cryptocurrency to leverage their trading position with the hope of increasing returns. Traders can borrow Tether (USDT) to open a leveraged long position, whereas Bitcoin borrowers can only short the cryptocurrency because they are betting on its price declining. Unlike futures contracts, the balance between margin longs and shorts isn’t always matched.
The above chart shows that traders have been borrowing more USDT recently, a fact shown by the ratio increasing from 9.6 on April 8 to the current 15.9, which is the highest level in two months.
Even though the margin lending reached 5 on March 28, the indicator favored stablecoin borrowing.
Crypto traders are usually bullish, so a margin lending ratio below 3 is deemed unfavorable. Thus, the current level remains positive, just less confident than the previous week.
Related: Bitcoin keeps falling as former BitMEX CEO gives $30K BTC price target for June
The long-to-short ratio is slightly bearish
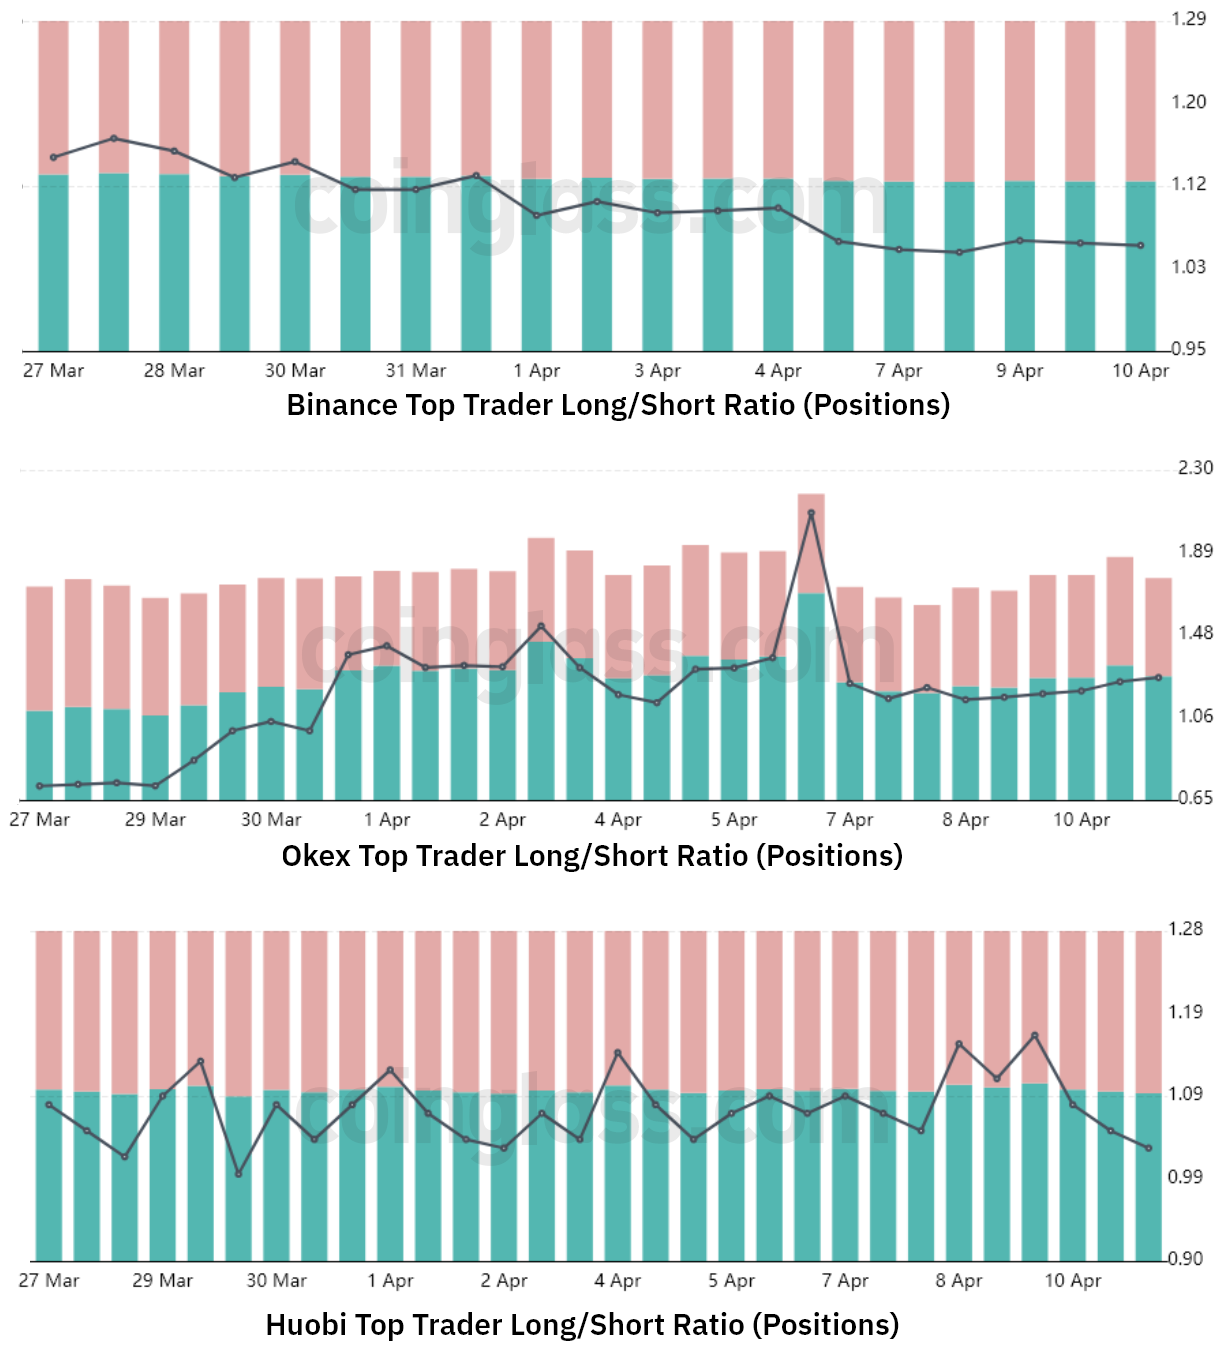
The top traders’ long-to-short net ratio excludes externalities that might have impacted the longer-term futures instruments. By analyzing these positions on the spot, perpetual and futures contracts, one can better understand whether professional traders are leaning bullish or bearish.
There are occasional methodological discrepancies between different exchanges, so viewers should monitor changes instead of absolute figures.

Excluding a brief spike in OKX’s Bitcoin long-to-short ratio on April 6, professional traders have slightly reduced their long (bull) positions since March 31. This movement is directly opposite to the previously presented margin trading markets, which showed a significant sentiment improvement in the first week of April.
So what could be the cause of the distortion? The most likely factor is the fact that Bitcoin’s price has been down 32% in 12 months. Even as BTC flirted with $48,000 on March 29, futures traders were not yet ready to build bullish positions using leverage.
It’s possible to have a “glass half full” reading from the same data because Bitcoin price dropped 15% since March 29, and yet, there is no sign of bearishness from the margin and BTC futures trading. From the perspective of derivatives, traders are playing it safe, but are also still hopeful that $50,000 and higher is possible in the near term.
The views and opinions expressed here are solely those of the author and do not necessarily reflect the views of Cointelegraph. Every investment and trading move involves risk. You should conduct your own research when making a decision.


