
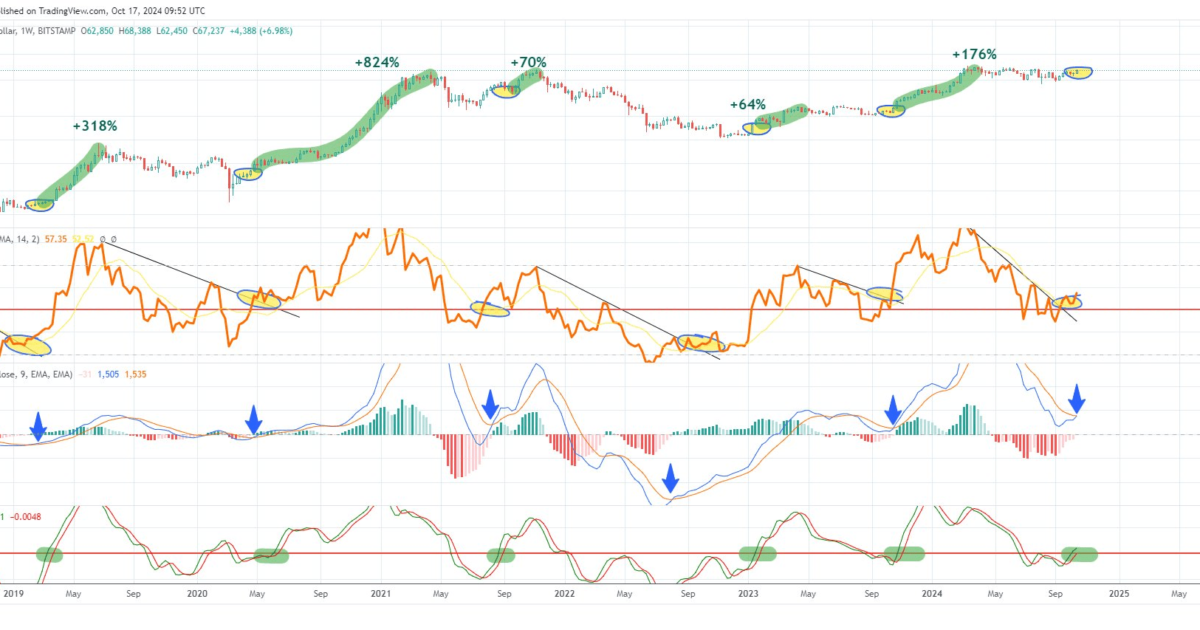
Henrik Zeberg, a macroeconomist known for his expertise in business cycles, has pinpointed an upcoming rally of at least 60% for the Bitcoin price in his latest technical analysis. The seasoned analyst has identified a pattern across three critical technical indicators that have historically signaled major upward price movements when all aligned.
Bitcoin Price Set For Next Bull Run
Zeberg highlights the Relative Strength Index (RSI), which is traditionally used to assess whether an asset is overbought or oversold. Currently, the RSI is positioned above the 50 mark, which often indicates growing bullish momentum. More importantly, the RSI has broken above a descending trendline that previously capped momentum, a shift that typically precedes robust price increases.
Related Reading
Alongside the RSI, the Moving Average Convergence Divergence (MACD) is showing a bullish crossover. This event occurs when the faster moving MACD line, depicted in blue, crosses above the slower signal line, shown in red. This crossover is a traditional signal used by traders to confirm a potential reversal from bearish to bullish market conditions. Zeberg’s emphasis on this crossover is consistent with its recognized predictive value in signaling the start of a bullish phase.
The third indicator, the Relative Vigor Index (RVGI), is lesser-known but no less critical. This indicator is also experiencing a bullish crossover, marked by the green line overtaking the red line. The RVGI measures the vigor of price movements and its crossover is indicative of a strong bullish undertone.
The chart provided by Zeberg is annotated with several instances where these conditions were met in the past, each followed by significant price rallies. These include surges of +318% in 2019, +824% in 2020, +70% in late 2021, +64% in January 2023, and +176% in the second half of 2023, indicating not just minor increases but substantial bull runs. The historical context adds weight to the current setup, suggesting that a similar outcome may be on the horizon.
Related Reading
Zeberg has pointed out that each time Bitcoin has shown this configuration of technical indicators, it has led to rallies of no less than 60%.” Every time we have seen a confirmation of the three following indicators, BTC has rallied and by minimum 60%,” Zeberg writes.
His confidence in this pattern is evident as he describes the potential for what he calls a “Blow-Off Top,” a term that suggests an intense and rapid increase in price. As reported by NewsBTC, Zeberg forecasts that a US recession is unavoidable, yet it will be preceded by a significant surge in financial markets, which includes a major rally in Bitcoin, potentially reaching between $115,000 and $120,000 in a “Blow-Off Top” scenario.
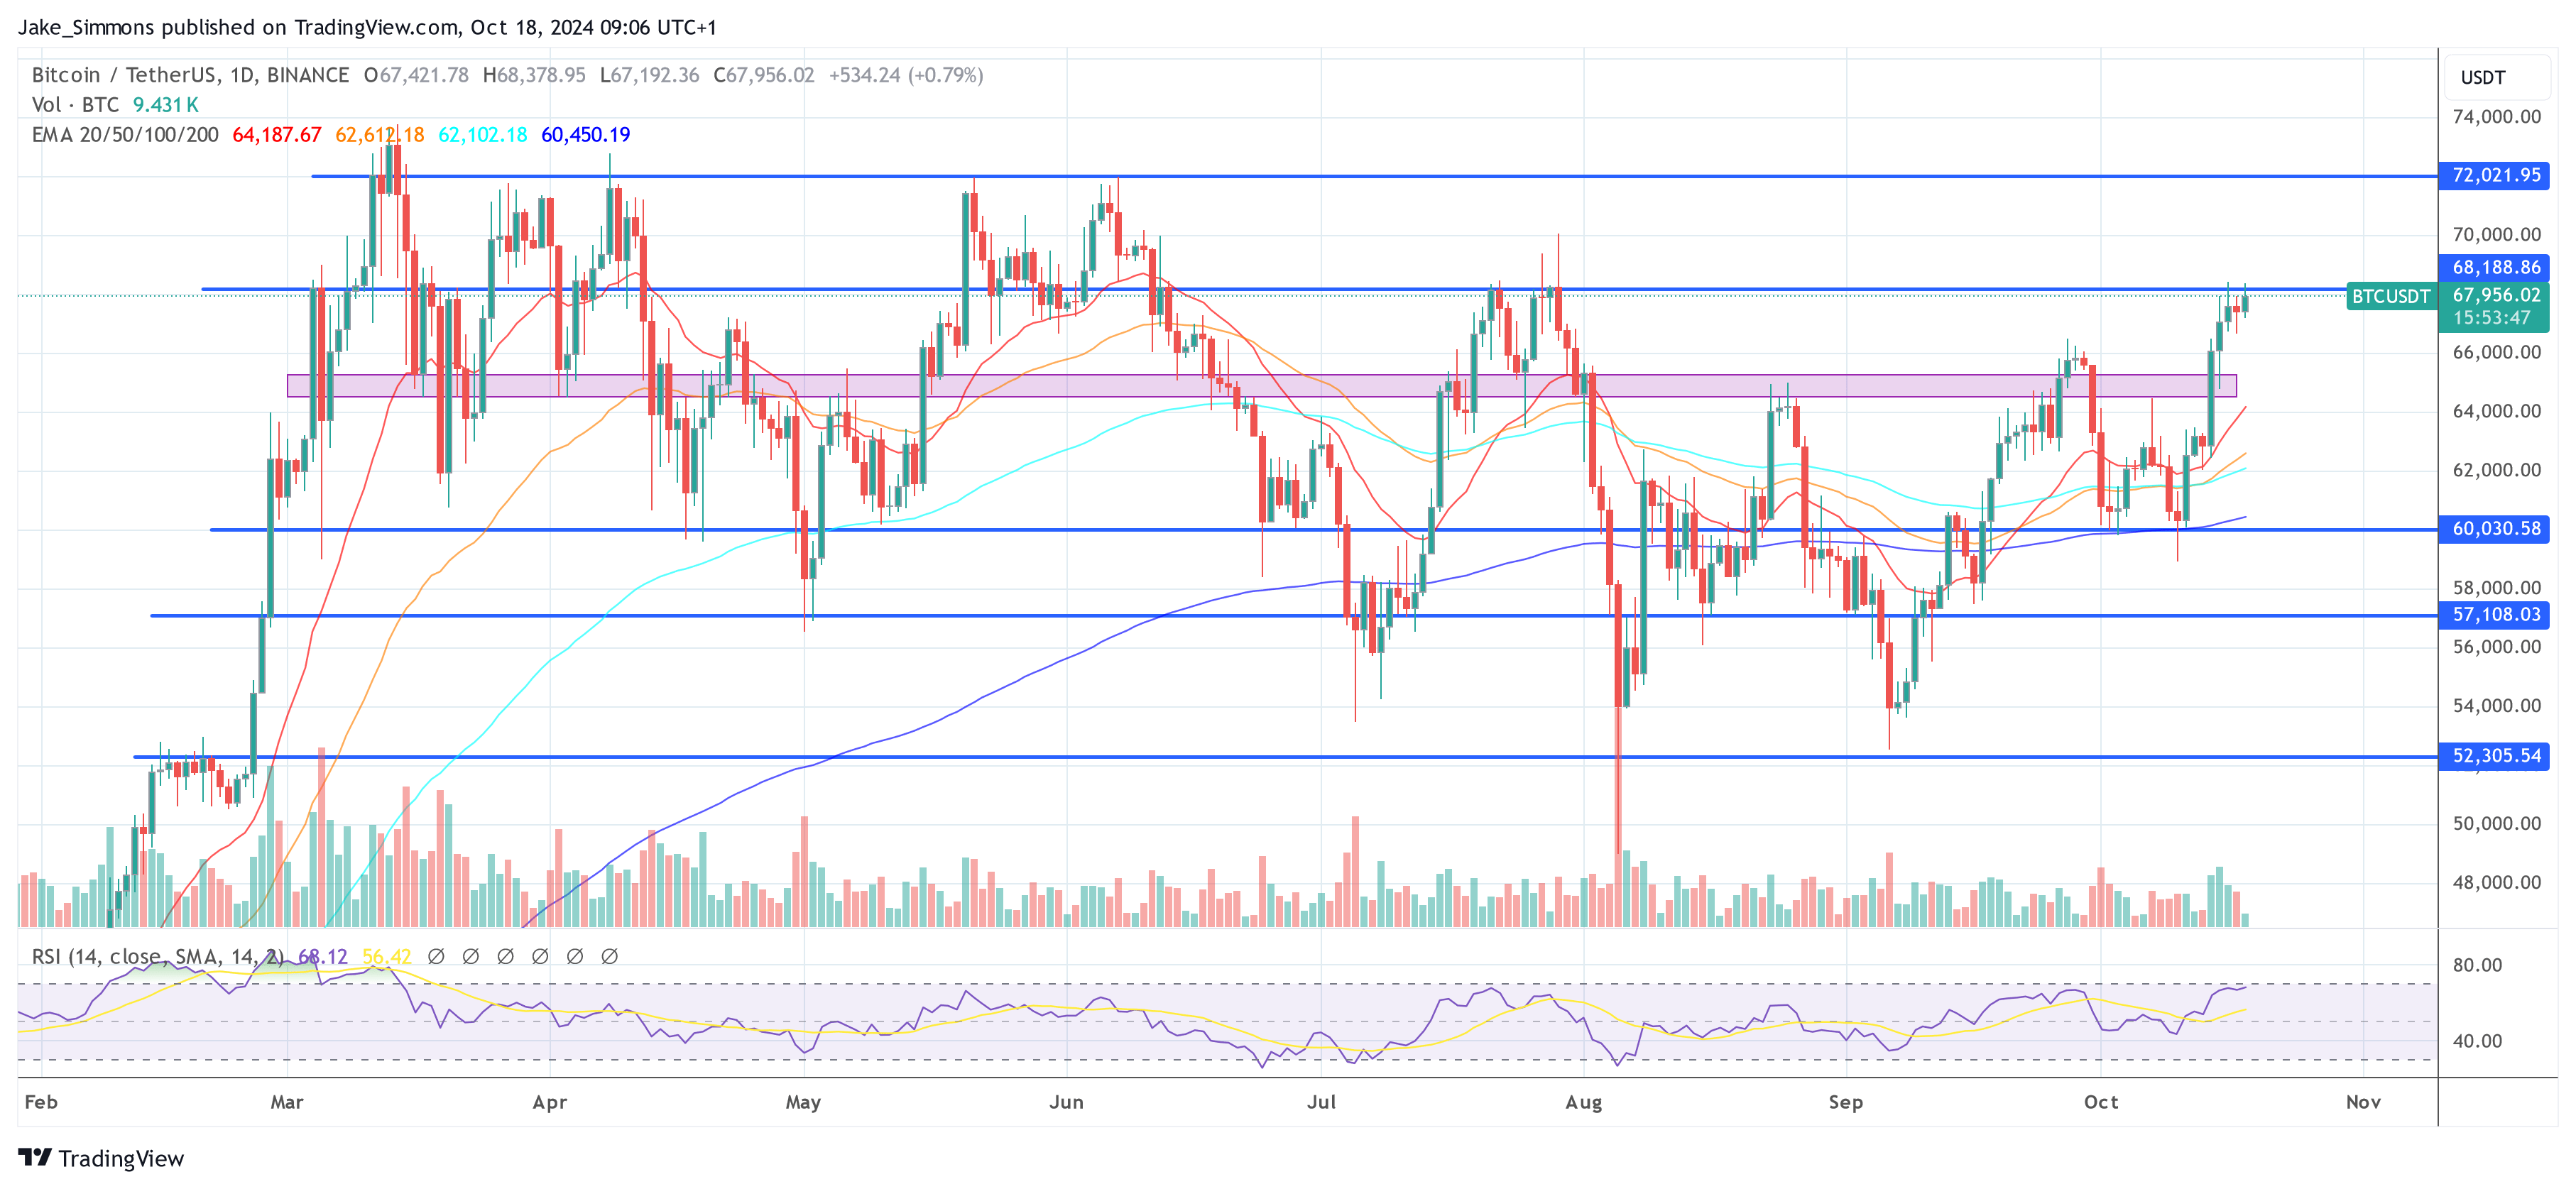
At press time, BTC traded at $67,956.
Featured image created with DALL.E, chart from TradingView.com


