An on-chain analyst has explained how Bitcoin is sitting like a coiled spring right now, a state the asset doesn’t usually stay in for too long.
Bitcoin Short-Term Holder Sell-Side Risk Ratio Has Declined Recently
In a new post on X, analyst Checkmate has discussed the recent trend occurring in the Sell-Side Risk Ratio for the Bitcoin short-term holders. The Sell-Side Risk Ratio here refers to an indicator that tells us about how the absolute profit and loss being locked in by the investors compares against the BTC Realized Cap.
The Realized Cap is basically a measure of the total amount of capital that holders as a whole have used to purchase their coins, as determined by on-chain data.
Related Reading
Thus, the Sell-Side Risk Ratio, which takes the ratio between the sum of profit and loss with this initial investment, provides info about how the profit or loss-taking from the investors looks like relative to their cost basis. When the value of the indicator is high, it means the holders are realizing a large profit or loss right now. Such a trend may follow some sharp volatility in the asset’s price.
On the other hand, the metric being low implies that investors are only selling coins close to their break-even level. This kind of trend could suggest profit or loss-takers in the market have become exhausted.
In the context of the current topic, the entire market’s Sell-Side Risk Ratio isn’t of interest, but rather that of only a specific segment of it: the short-term holders (STHs). These investors are typically defined as those who acquired their coins within the past 155 days.
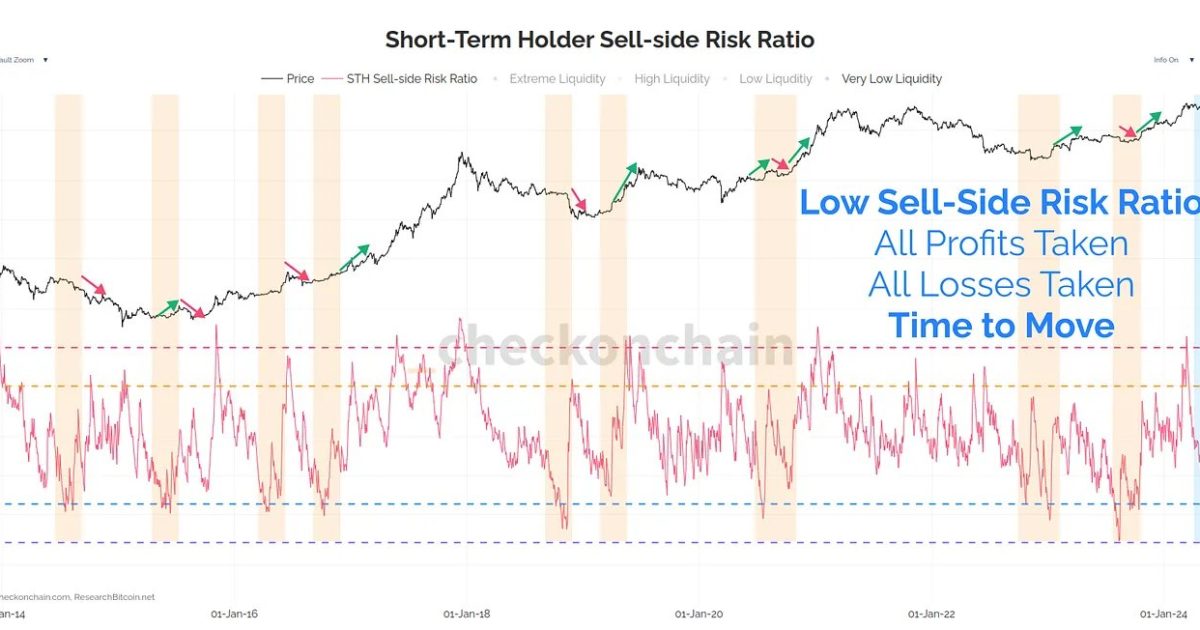
The below chart shows the trend in the metric for this cohort over the past decade:
As is visible in the graph, the Sell-Side Risk Ratio for the Bitcoin STHs had shot up to a very high level when the rally towards the new all-time high (ATH) had occurred earlier in the year. Historically, the STHs have shown to be the fickle-minded hands of the market, who sell easily at the sight of any FOMO or FUD in the sector. As such, it’s not surprising to see that these investors had ramped up their profit realization alongside the rally.
Related Reading
Since this peak, though, the indicator has gone through a steep decline as the price of the cryptocurrency has been stuck in endless consolidation. Following the drawdown, the metric has now returned to relatively low levels.
It would appear that as the tight sideways movement has occurred, sellers among the STHs have seen exhaustion. “Bitcoin is coiled like a spring, and it usually doesn’t sit still like this for long,” notes the analyst. With the asset’s price surging to $71,000 in the past day, it’s possible that this unwinding may already be here.
BTC Price
Bitcoin has enjoyed an increase of around 3% in the past 24 hours, which has now taken its price to $70,900.
Featured image from Dall-E, checkonchain.com, chart from TradingView.com


