Bitcoin price like a flash of lightning shot up by more than $5,000 in the last 48 to 72 hours, and the forecast just turned from cloudy with a chance of downside to much sunnier days for bulls ahead.
In fact, one technical indicator points to at least $46K from here, and shows that there’s very little resistance above this left stopping Bitcoin from continuing to set new all-time highs.
The Current Crypto Market Price Action “At A Glance”
When markets move sideways for an extended period of time, it can be tricky to tell which direction the asset will head next once the range ultimately breaks. Throw a speculative asset like Bitcoin or other cryptocurrencies into the mix, and even sideways price action can feel like a rollercoaster of emotions.
After a frightening sweep lower, anyone who managed to stay on this volatile ride could be ready to climb to new highs, according to a market forecasting tool.
Related Reading | The Fibonacci Sequence And Why $30K Bitcoin Is So Important
The tool, created by journalist Goichi Hosoda, is called Ichimoku Kinko Hyo – which translates loosely in Japanese to “a glance at a chart in equilibrium.”
The extremely busy looking tool comes equipped with a variety of spans – some lagging, some leading, and others moving right along with price action.
The next target is the Kijun-sen at $46K | Source: BTCUSD on TradingView.com
The weekly Bitcoin price chart closed above the Tenkan-sen for the first time since losing it in April as support, which suggests that the next stop is the Kijun-sen or baseline – which is located at roughly $46,000.
Why The Bitcoin Forecast Says New Highs Are Possible
Past instances where the top cryptocurrency by market cap retested the key level resulted in a rejection, however, each time in the past had built up bear market resistance to deal with.
With Bitcoin price above the cloud still on weekly timeframes, if price action can reclaim the Kijun-sen next then there’s next to no resistance left above it. There’s some resistance left behind according to the Chikou span – or lagging span around $60,000 but beyond that point there is nothing but clear skies beyond for Bitcoin.
Related Reading | Why The Next Bitcoin Bear Market Will Be The Worst Yet
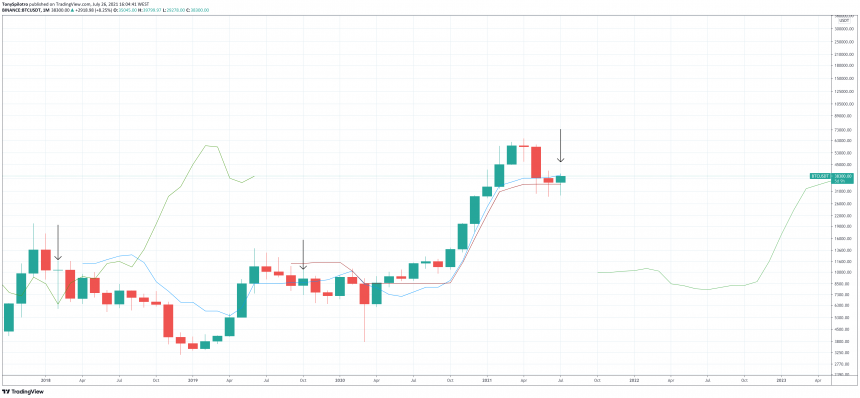
The Tenkan-sen and Kijun-sen are the two most important tools within the Ichimoku. Not only can they act as support and resistance for price action, but if the Tenkan-sen is above the Kijun-sen, then the asset is considered bullish.
Closing above the Tenkan-sen should lead to new highs | Source: BTCUSD on TradingView.com
On even higher timeframes, Bitcoin price is holding just fine above the Kijun-sen, and is pressed right up against Tenkan-sen resistance. A close above here the level would leave nothing but a bullish crypto chart behind, with limited resistance and nothing but price discovery ahead.
Is that’s what’s next for Bitcoin?
Follow @TonySpilotroBTC on Twitter or via the TonyTradesBTC Telegram. Content is educational and should not be considered investment advice.
Featured image from iStockPhoto, Charts from TradingView.com


