Bitcoin has broken out of its range for the second time in the past month. The first cryptocurrency by market cap is making its way up from its yearly low, $29,900, after a season trending to the downside.
At the time of writing, BTC trades at $52,333 with a 1.4% and 7% profit in the daily and weekly charts, respectively. Bitcoin smashed the major resistance at $52,000, as news about El Salvador buying its first BTC came out of that country’s presidential office.
The bulls are back in control, it would seem, and Bitcoin could potentially rise to its next resistance level at around $56,000, for the first time since May. If it does break that resistance, the bulls could attempt a move into the $60,000 area.
This could put BTC’s price in the “path of least resistance”, as Senior Commodity Strategist for Bloomberg Intelligence Mike McGlone said. The price target for that path is $100,000 by the end of 2021 for the first cryptocurrency by market cap, and $5,000 for the second, Ethereum. McGlone noted:
After enduring a gut-wrenching correction, we see the crypto market more likely to resume its upward trajectory than drop below the 2Q lows. What could stop Bitcoin and Ethereum from achieving record highs in 2H may be the more elusive question. Increasing demand and adoption are facing diminishing supply.
A report by Glassnode support the bullish thesis for the short term. The firm records a recovery in the mining sector after these operators were forced to move from China and relocate to other regions.
The recent appreciation in the crypto market has allowed BTC miners to secure profits, the report claims. Thus, the Miner Net Position Change “has returned to a neutral area”.
Institutions Back On Bitcoin, Indicators Suggest More Profits
This Glassnode indicator has been used to measure the correlation between the number of coins accumulated or sold by miners and the price of Bitcoin. Therefore, the selling pressure that drove down BTC’s price during May and June seems to be out of the picture.
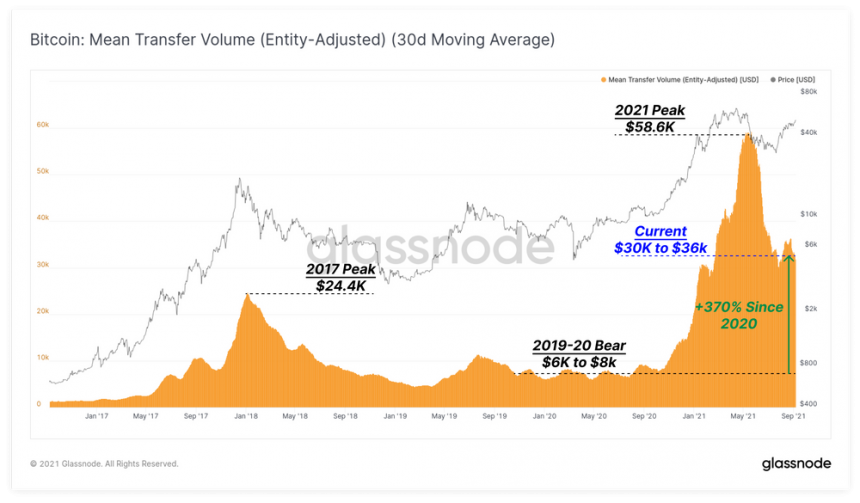
In addition, Glassnode records a permanent rise in the transaction size made by BTC users. This has created a contrast from the current market cycle to the previous one and suggests institutions have stayed on the network despite the 50% decline in the price of Bitcoin during May.
As seen below, the transaction size has experienced an important increase reaching a peak during that month. Glassnode added:
This has largely cooled off from July onwards, with the current average transaction size between $30k and $36k. Relative to the 2019-20 period, this represents a significant 370% increase, despite the recent correction, reflecting continued and sticky institutional sized interest.

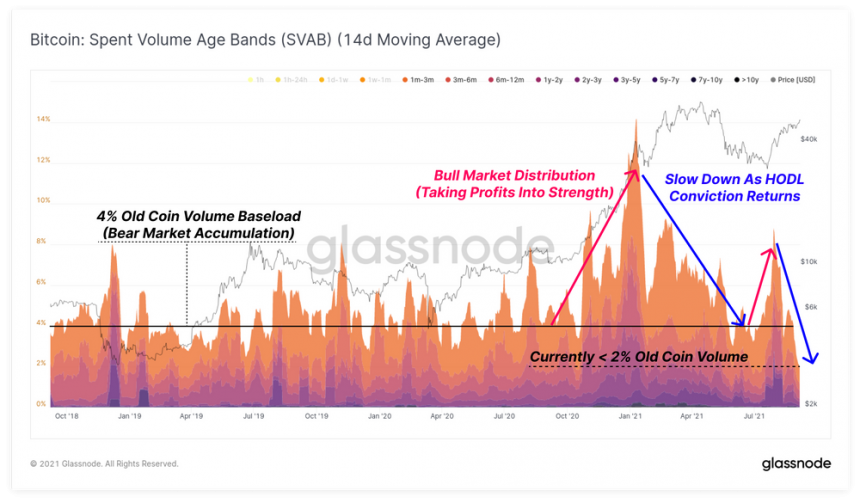
In addition, Glassnode claimed that investors have high levels of conviction to hold their Bitcoin, as suggested by the Spent Volume Age Band, a metric used to classify the proportion of daily coin volume by coin-age.
In other words, the number of BTC being sold on the market and how long have investors have held on to those coins. At moment, the BTC traded is part of the “younger coins”, while “old coins remain dormant”.

Bitcoin could once again be impacted by a domino effect caused by the derivatives sector. As the price tries to reclaim previous highs, speculators and short-term investors turn to futures contracts to amplify their gains.
Related Reading | New To Bitcoin? Learn To Trade Crypto With The NewsBTC Trading Course
This is causing the funding rates for this product to rise. The research firm records a 0.03% for this metric across exchange platforms, levels “seen prior to the May sell-off”. So, investors remain cautious and keep an eye on the Bitcoin futures. Glassnode added:
The combination of positive funding rates and high open interest can be an important indicator set for assessing a shorter term risk of cascading long liquidations.


