Bitcoin volatility earlier in this week reached some of the most explosive price action in the asset’s history. In just a four hour window, the cryptocurrency rose and fell more than $1,000 each way, gyrating back and forth as buyers and sellers attempt equilibrium.
But after that powerful surge, indecision is showing through a reduction in volatility, and a tightening trading range. Bulls and bears are both in a standoff at this point, and either a drop is near, or $19,500 will finally give in as resistance. Here’s a look at how close the crypto asset is coming to a break in one direction or the other.
Bitcoin Price Action Pauses Under $20K, Bearish Or Bullish Consolidation?
Bitcoin price action has been more explosive than ever, resulting in the leading cryptocurrency by market cap setting a new all-time high price record.
But after setting the new high, FOMO didn’t push price past $20,000 resistance. What the crypto community calls “OG whales” who bought BTC in the early days are selling, offsetting the enormous momentum from new retail money and institutional traders.
It has led to an impasse or standoff like situation between bears and bulls over the last 24 hours.
The Bollinger Bands are contracting and gearing up for a big squeeze | Source: BTCUSD on TradingView.com
The chart above shows the declining volatility since the last large move, indicated by the Bollinger Bands contracting to a “squeeze.” As previous examples show, when the indicator coils, energy is released in either direction.
Related Reading | The Dollar Losing A Decade Long Trendline Could Send Bitcoin Skyrocketing
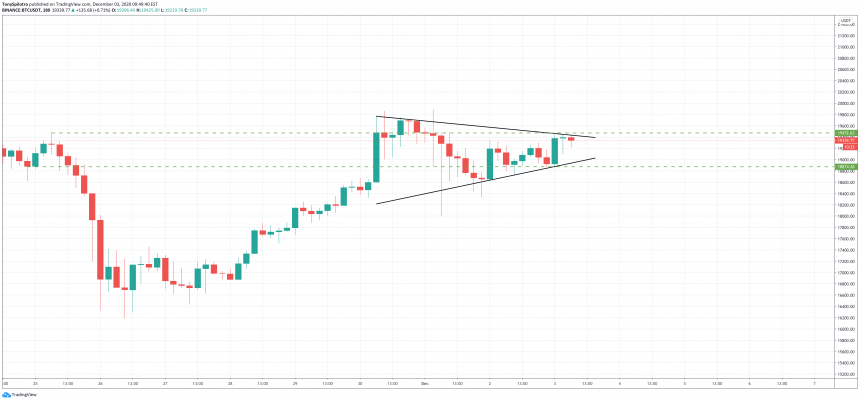
But which direction isn’t as clear. A low-timeframe symmetrical triangle could be forming, which doesn’t do much to help point to one path or another.
A symmetrical triangle could provide the climax to the consolidation below all-time high | Source: BTCUSD on TradingView.com
What is clear, is that a strong enough break above $19,475, or a fall below $18,875, could trigger the decision-making move.
For those considering trading this madness, beware of false breakouts in either direction and look for additional confirmations such as high volume.
Related Reading | Ten Different Bearish Divergences Stack Against Bitcoin, But Drop Has Yet To Arrive
It is worth noting that consolidation below resistance is often bullish, and a sign that the asset is ready to break through it.
Featured image from Deposit Photos, Charts from TradingView.com


