In brief:
- Earlier today, BTC posted a local peak of $9,787.
- Bitcoin has been oscillating between $8,900 and $9,800 for over a week.
- BTC is still highly correlated to the S&P 500.
- Perhaps it is time the correlation worked in favor of Bitcoin to boost it above $10,000.
In the last 24 hours, Bitcoin has had an impressive push from around $9,200 to a local peak of $9,787 – Binance rate. However, this move by Bitcoin is still within the range of $9,800 and $8,900 where BTC has been experiencing sideways movement since the 11th of June. Keen traders and investors have their eyes set at $9,800 due to the fact that a clear breakout above this level might just have enough momentum for BTC to attempt and hold $10,000 once again.
Bitcoin’s Correlation with the S&P 500 is High
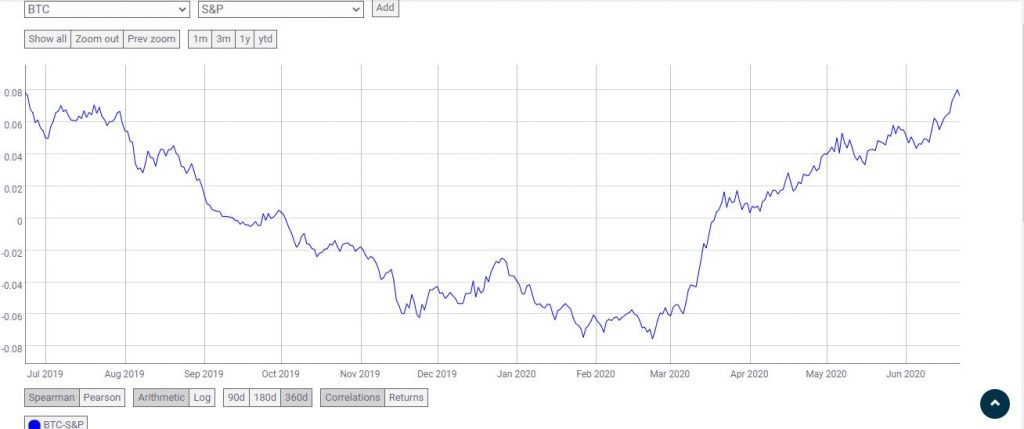
Amidst the tense Bitcoin market action, BTC’s correlation with the S&P 500 has not escaped the eyes of analysts in the crypto-verse. In mid-May, and according to the team at Coinmetrics, the correlation was at a value of 0.36. The same correlation using the same 90 day sampling period, now stands at 0.17.
However, when the sampling period is increased to 360 days, the correlation chart provides a different picture of where Bitcoin is still highly correlated to the S&P 500 as can be seen in the screenshot below.
Bitcoin can Use the Stock Market to Break $10,000
As the chart above illustrates, the high correlation of Bitcoin with the S&P 500 might not be a bad thing at the moment. With the stock markets experiencing the once doubtful V-shaped recovery, an extension of the stock market rally should have the required effect to nudge BTC above the psychological price of $10,000.
The creator of the Bitcoin stock-to-flow model, @100trillionUSD, has come up with a formula that predicts a $20,000 Bitcoin in the near future. Key to the formula is the real-time value of the S&P 500. Below is a tweet by @100trillionUSD with the formula using an S&P 500 value of $3,100.
#BTC= $3100^8.7*e^-60 = $20K🚀 pic.twitter.com/ZiayoPdzn2
— PlanB 🔴 (@100trillionUSD) June 22, 2020
In a follow up to the analysis, @100trillionUSD has further postulated that the last 3 dips by Bitcoin were not caused by Bitcoin whales dumping their BTC in the crypto markets.
So we know #bitcoin and S&P500 are correlated and cointegrated. Chart shows both BTC and S&P. Last 3 dips in BTC and S&P (yellow) were caused by anti-China measures, FED taper tantrum, corona virus. Important lesson from this is IMO: BTC futures or whales did NOT play a big role.
The full tweet explaining the analysis can be found below.
So we know #bitcoin and S&P500 are correlated and cointegrated. Chart shows both BTC and S&P. Last 3 dips in BTC and S&P (yellow) were caused by anti-China measures, FED taper tantrum, corona virus. Important lesson from this is IMO: BTC futures or whales did NOT play a big role. pic.twitter.com/xfcZnSdZxh
— PlanB 🔴 (@100trillionUSD) June 23, 2020
Conclusion
Bitcoin is still highly correlated to the stock markets as seen with the S&P 500. Furthermore, the correlation might not be a bad thing at the moment. It will be essential for Bitcoin to break and hold the psychological price level of $10,000.
Evidence of this correlation being beneficial for Bitcoin has been supplied by Plan B, also known as @100trillionUSD. Therefore, for Bitcoin to break and hold $10,000, a stock market rally might be necessary to provide the necessary momentum for BTC.
Disclaimer: This article is not meant to give financial advice. Any additional opinion herein is purely the author’s and does not represent the opinion of EWN or any of its other writers. Please carry out your own research before investing in any of the numerous cryptocurrencies available. Thank you.


