For many Bitcoin investors who lived it, this crypto winter feels more painful than the 2018 bear market, despite making a shallower fall from peak to through. From a monthly momentum perspective, the bearish trend is now the strongest on record. Let’s take a look at what this means and where the market is at by comparison.
Log MACD Points To Worst Crypto Winter In History
As a speculative asset class, cryptocurrencies are volatile – wildly driven by speculation and polar opposite ends of greed and fear. There is no denying the current market is some of the most fearful since Bitcoin’s inception. It was born in wake of the 2008 financial crisis and the top cryptocurrency is now facing its first potential recession.
Previous monetary policy allowed the asset class to flourish and grow, while the current policy has caused prices to contract significantly in short order. The result, is quite possibly the worst bear market in Bitcoin’s history, according to the LMACD.
Monthly bearish momentum is the strongest ever | Source: BTCUSD on TradingView.com
LMACD is the logarithmic version of the Moving Average Convergence Divergence indicator. The original tool was created by Gerald Appel in the late 1970s, while this version is best used to compare historical momentum.
When viewing the monthly LMACD for BTCUSD, the dashed zero line shows that in 2018, Bitcoin never even made it into bear territory. During this bear market, the MACD line in blue is also at the lowest point ever historically. The signal line in orange has never moved below the zero line, and could very well do so in this cycle.
Has The Bitcoin Bull Trend Officially Ended?
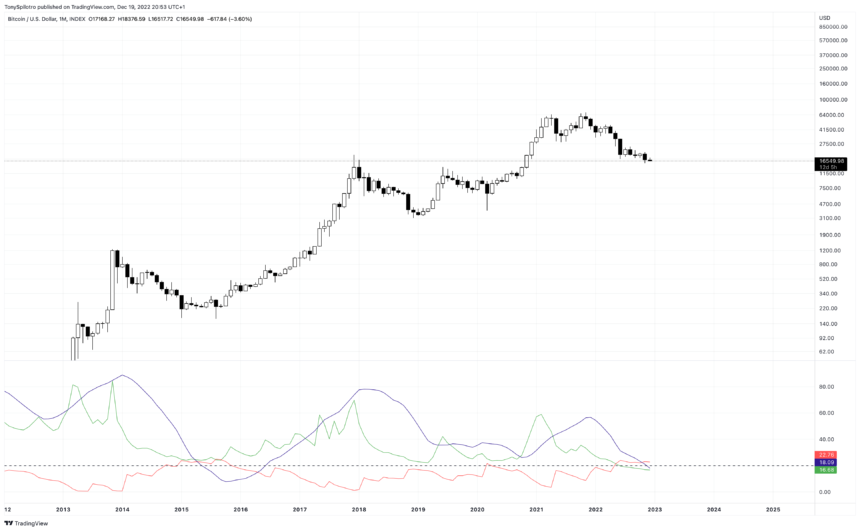
According to the Average Directional Index and each Direction Movement Indicator, bears are stronger than ever before, and have had the upper hand in crypto for the longest stretch ever.
Falling below a reading of 20 suggests the end of a trend, potentially indicating that the trend that started in 2015 is only now truly concluding. Rising back above a reading of 20 after falling below it, should help confirm a new bullish trend.
The bull trend has ended, but will a new one begin? | Source: BTCUSD on TradingView.com
Although the ADX shows the bull trend never quite concluded in 2018, the weaker trend strength overall explains why the returns stemming from the 2018 bottom, weren’t anywhere near the same as the rally from the 2015 bottom, which had significant strength at its back.
With the bullish trend fizzling out, when bulls regain control and a new trend blossoms, it could be far more sustainable than what we have witnessed the last several years in crypto.


