

Key points:
-
Bitcoin’s bounce from the $100,000 shows buyers are committed to the overarching bull trend.
-
Select altcoins have broken below respective support levels, suggesting further weakness for mid-caps in the near term.
Bitcoin (BTC) has held above the psychological support of $100,000, but the strength of each will determine whether or not the bullish trend remains intact. BitMEX founder Arthur Hayes sounded positive in a post on X, saying that Bitcoin’s weakness shall pass, leaving no doubt about its safe haven status.
Bitcoin’s relative stability compared to the top US stocks during the current geopolitical crisis shows it is maturing as an asset class. Bitwise Europe Head of Research André Dragosch shared a chart on X, showing Bitcoin’s 60-day realized volatility at 27-28%, lower than the S&P 500 Index (SPX) at roughly 30%, the Nasdaq 100 at about 35% and the “Magnificent 7” technology stocks close to 40%.
The failure to break out to a new high has not created panic among institutional investors, who continue to buy Bitcoin. CoinShares reported on Monday that Bitcoin exchange-traded products (ETPs) witnessed inflows of $1.1 billion for the trading week ending Friday. Inflows, despite a fall in the spot price, show that investors were buying on weakness, the report added.
Could sellers pull Bitcoin back below $100,000, or will buyers succeed in pushing the price higher? How are altcoins likely to behave? Let’s analyze the charts of the top 10 cryptocurrencies to find out.
S&P 500 Index price prediction
The S&P 500 Index has pulled back to the 20-day exponential moving average (5,950), indicating selling by the bears in the 6,000 to 6,147 zone.
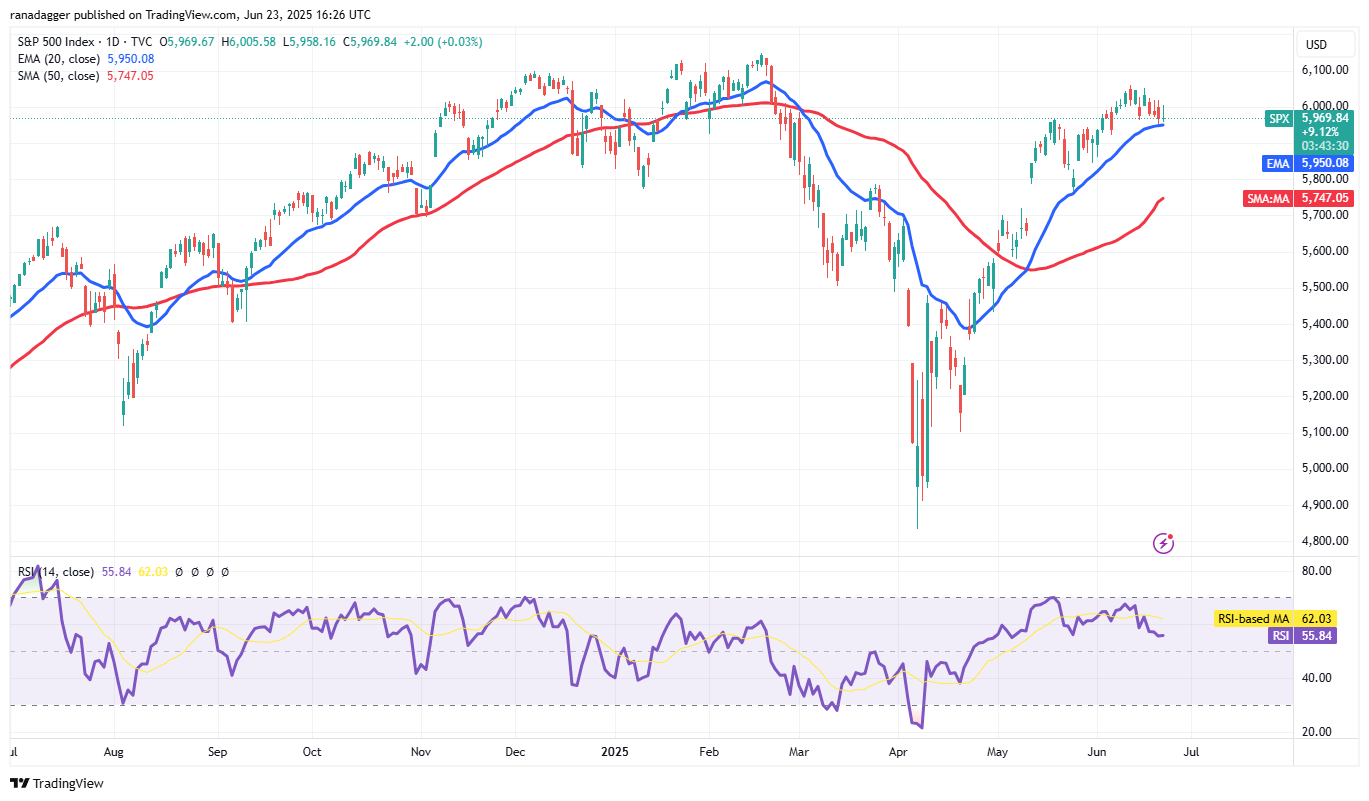
If the price dips and maintains below the 20-day EMA, the index could plunge to the 50-day simple moving average (5,747). Buyers are expected to defend the 50-day SMA with all their might because a break below it may sink the index to 5,580. The deeper the pullback, the greater the time needed for the uptrend to resume.
This negative view will be invalidated if the price bounces off the 20-day EMA and rises above 6,060. That sets the stage for a retest of the all-time high at 6,147. A break above the 6,147 level signals the start of the next leg of the uptrend toward 6,500.
US Dollar Index price prediction
The failure of the bears to sustain the price below the 97.92 support started a bounce, which has reached the moving averages.
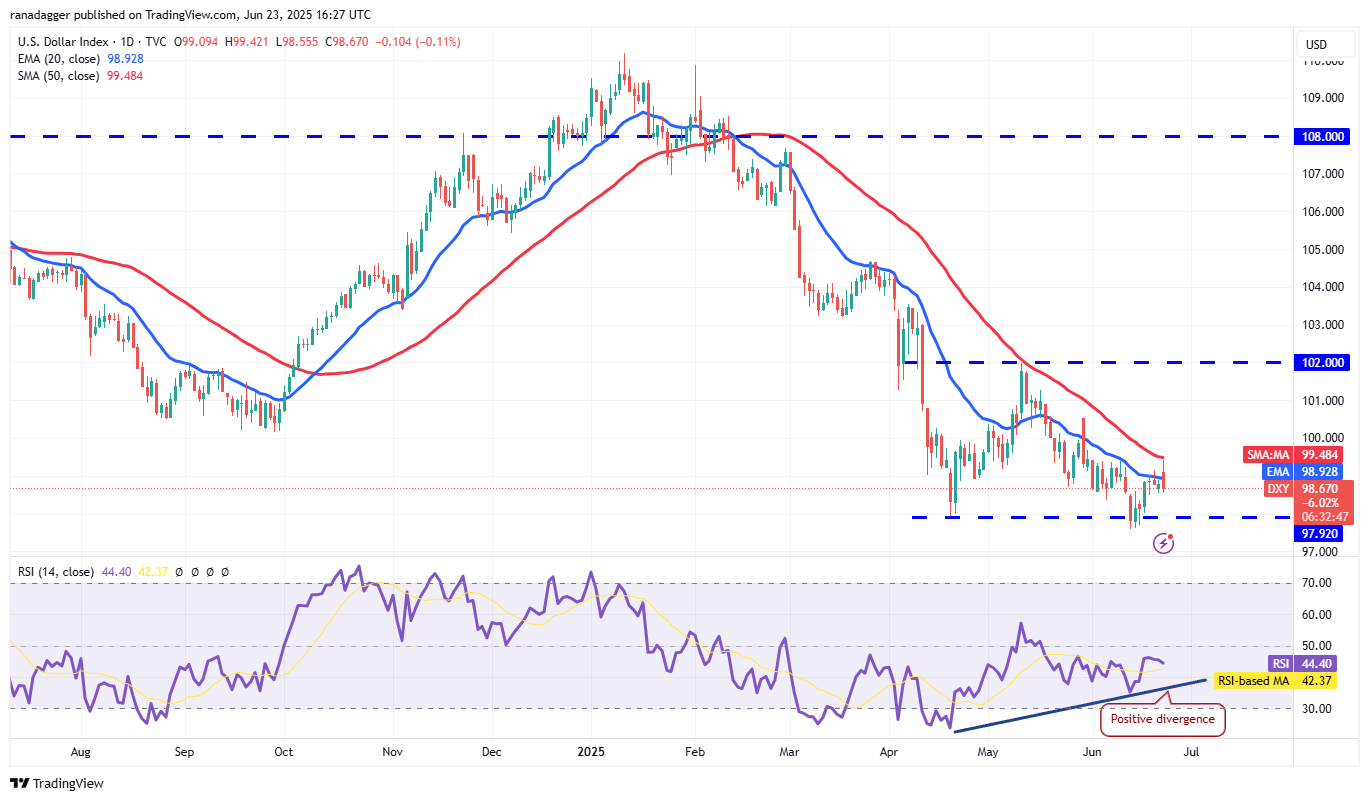
The 20-day EMA (98.92) is flattening out, and the positive divergence on the relative strength index (RSI) signals that the selling pressure is reducing. That increases the possibility of a break above the 50-day SMA ($99.48). If that happens, the index could march to 100.54 and, after that, to the 102 resistance.
If bears want to retain control, they will have to successfully defend the moving averages and swiftly pull the price below the immediate support at 98.48. If they do that, the index could retest the crucial support at 97.60.
Bitcoin price prediction
Bitcoin fell below the crucial $100,000 support on Sunday, but the bulls aggressively purchased the dip, as seen from the long tail on the candlestick.
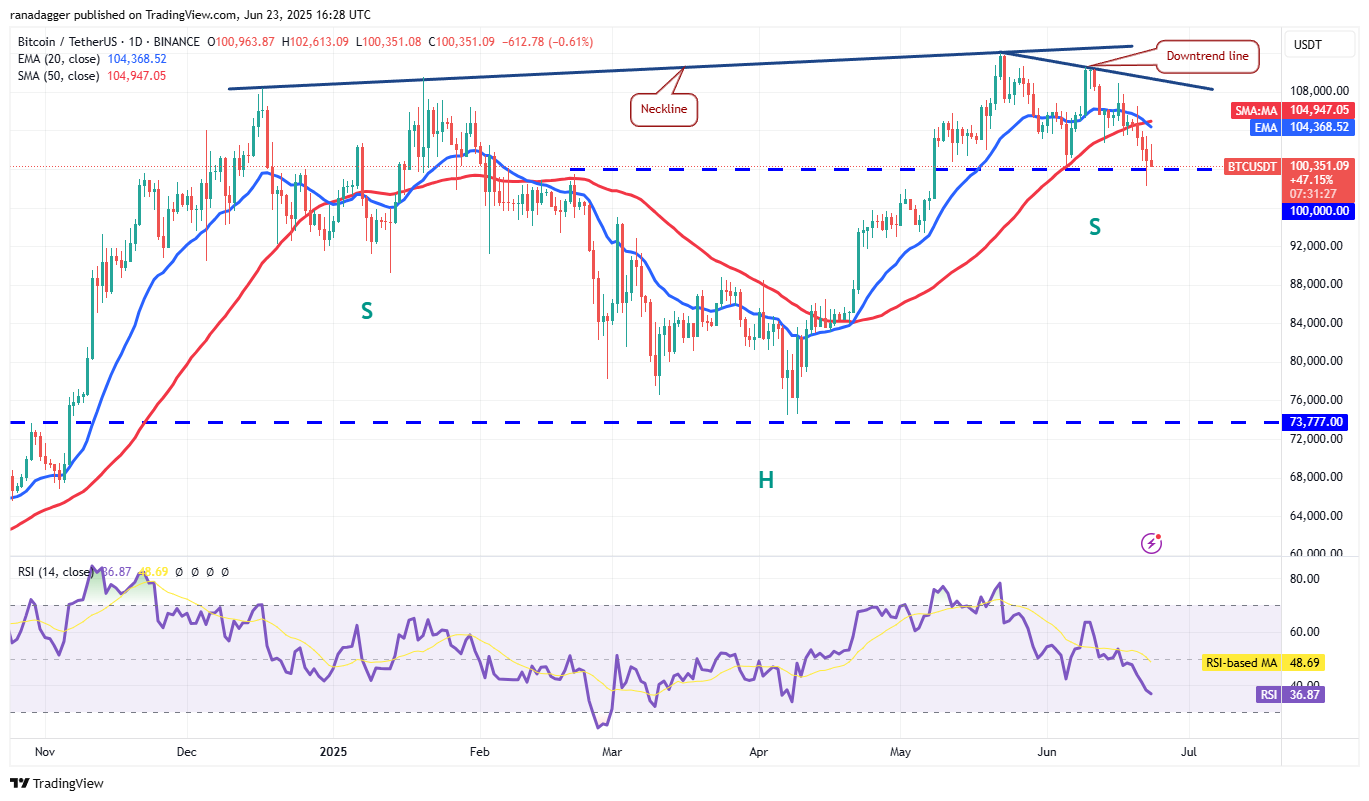
The bulls tried to start a relief rally but are facing selling at higher levels. If the price turns down from the current level or the moving averages, the bears will make another attempt to sink and maintain the BTC/USDT pair below $100,000. If they can pull it off, the pair may tumble to $93,000.
Contrary to this assumption, if buyers shove the price above the moving averages, the pair could rally to the downtrend line. Sellers are expected to mount a strong defense in the zone between the downtrend line and the all-time high of $111,980.
Ether price prediction
Ether (ETH) rebounded off the $2,111 support on Sunday, indicating solid demand at lower levels.
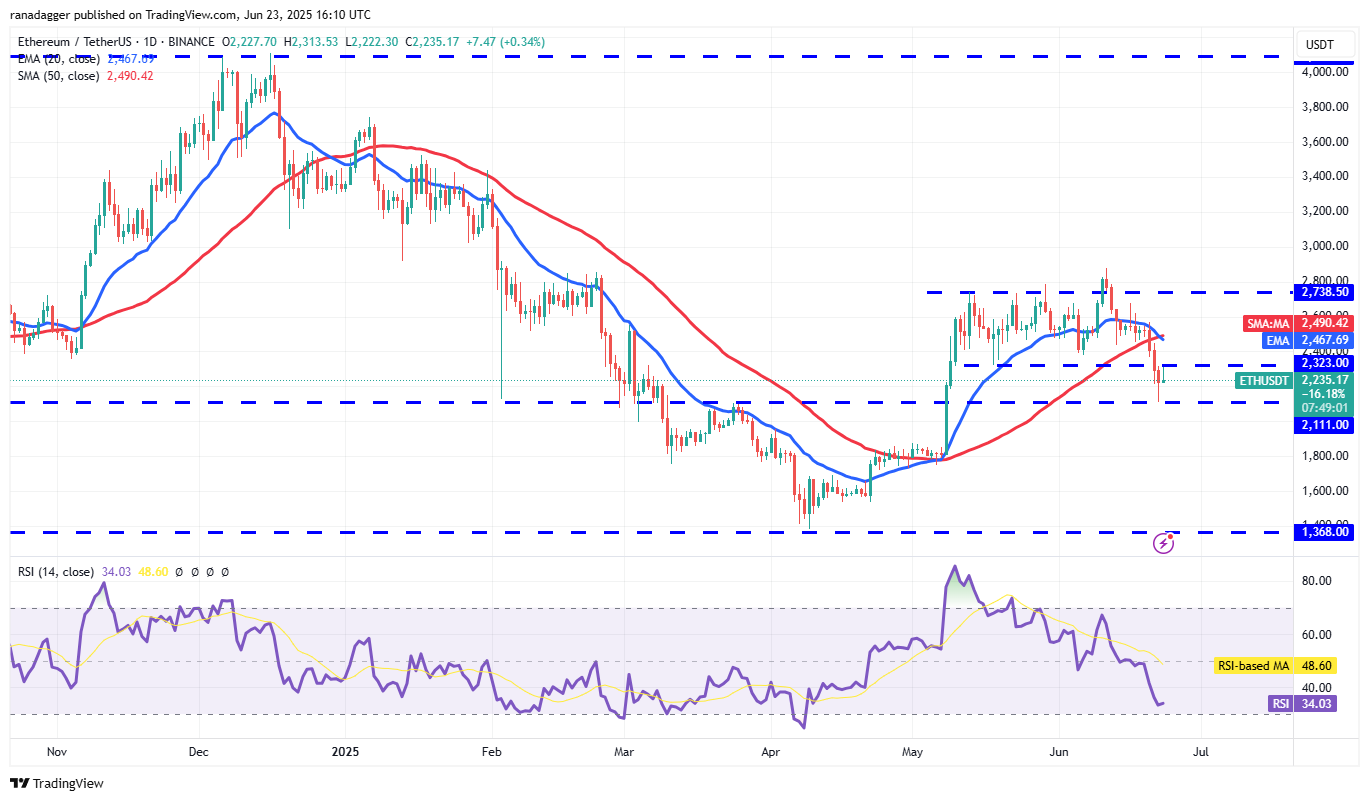
The bulls are trying to push the price above the breakdown level of $2,323 but are facing significant resistance from the bears. If the price turns down from $2,323, it heightens the risk of a break below $2,111. The ETH/USDT pair may then collapse to $1,754.
Buyers are likely to have other plans. They will try to push the price above the 20-day EMA ($2,467). If they succeed, it suggests that the $2,111 level is likely to act as a new floor. The pair could then rally to $2,738.
XRP price prediction
XRP (XRP) fell below the $2 support on Sunday, but the bulls purchased the dip, as seen from the long tail on the candlestick.
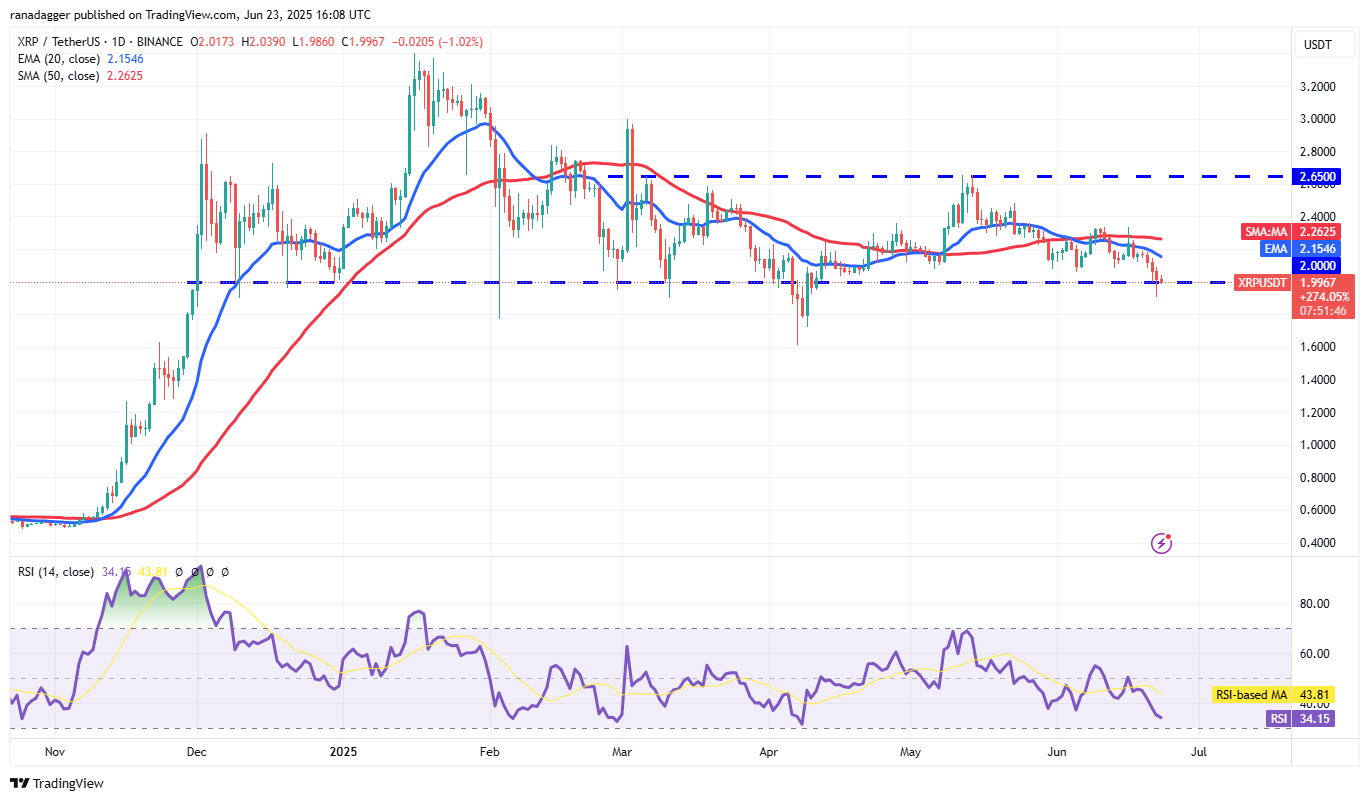
The bears are unlikely to give up easily and will try to halt the relief rally at the 20-day EMA ($2.15). If the price turns down from the current level or the 20-day EMA, the XRP/USDT pair risks a drop to the $1.61 support.
On the contrary, a break above the 20-day EMA suggests the markets rejected the break below the $2 level. The pair could rise to the 50-day SMA ($2.26), extending its stay inside the $2 to $2.65 range for some more time.
BNB price prediction
BNB (BNB) broke below the $634 support on Saturday, indicating that the range-bound action has resolved in favor of the bears.
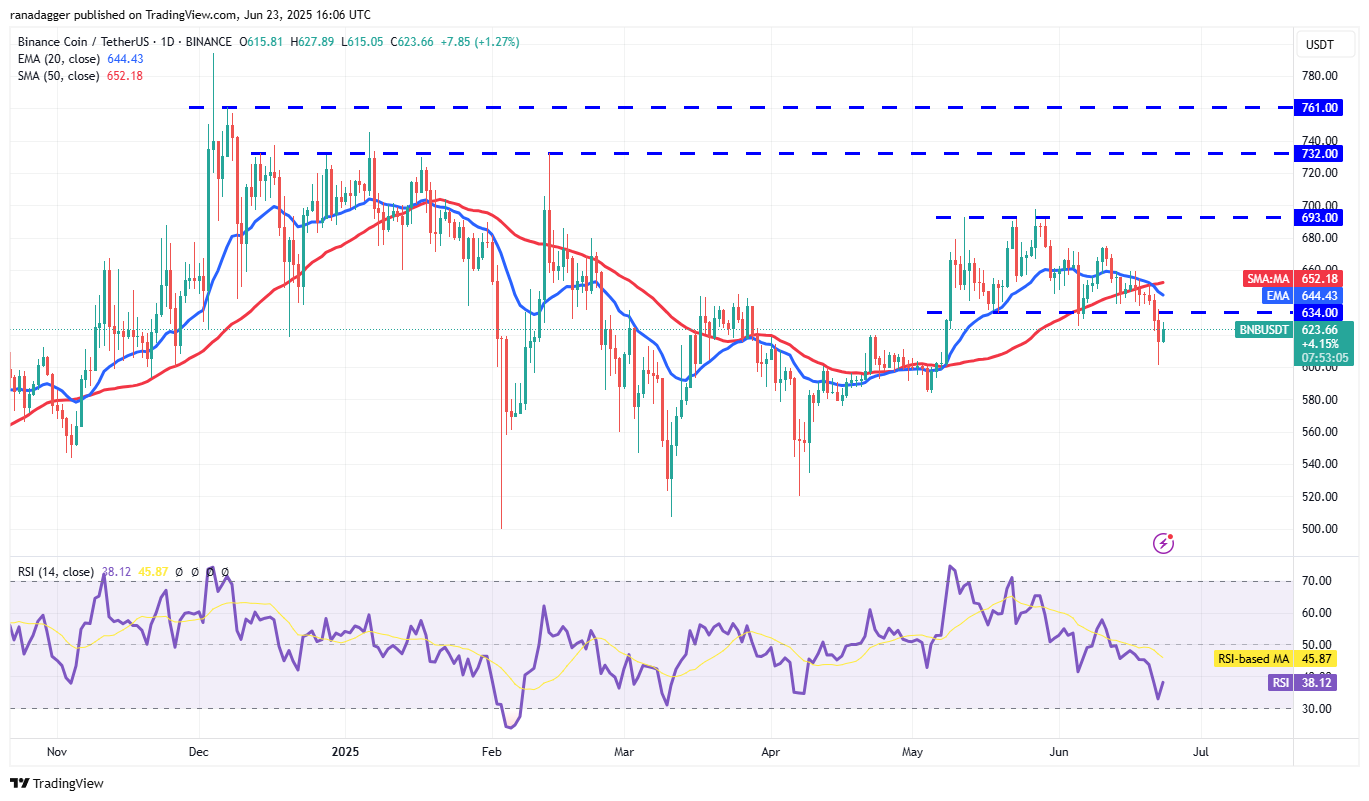
The BNB/USDT pair bounced off the $600 support on Sunday, but the recovery is expected to face selling at the breakdown level of $634. If the price turns down from $634, it suggests that the bears have flipped the level into resistance. That increases the possibility of a drop to the strong support at $580.
Buyers will have to propel the price above the moving averages to prevent the downside move. If they do that, the pair could ascend to $675.
Solana price prediction
Solana (SOL) fell below the $140 support on Saturday and extended the decline near the $123 support on Sunday.
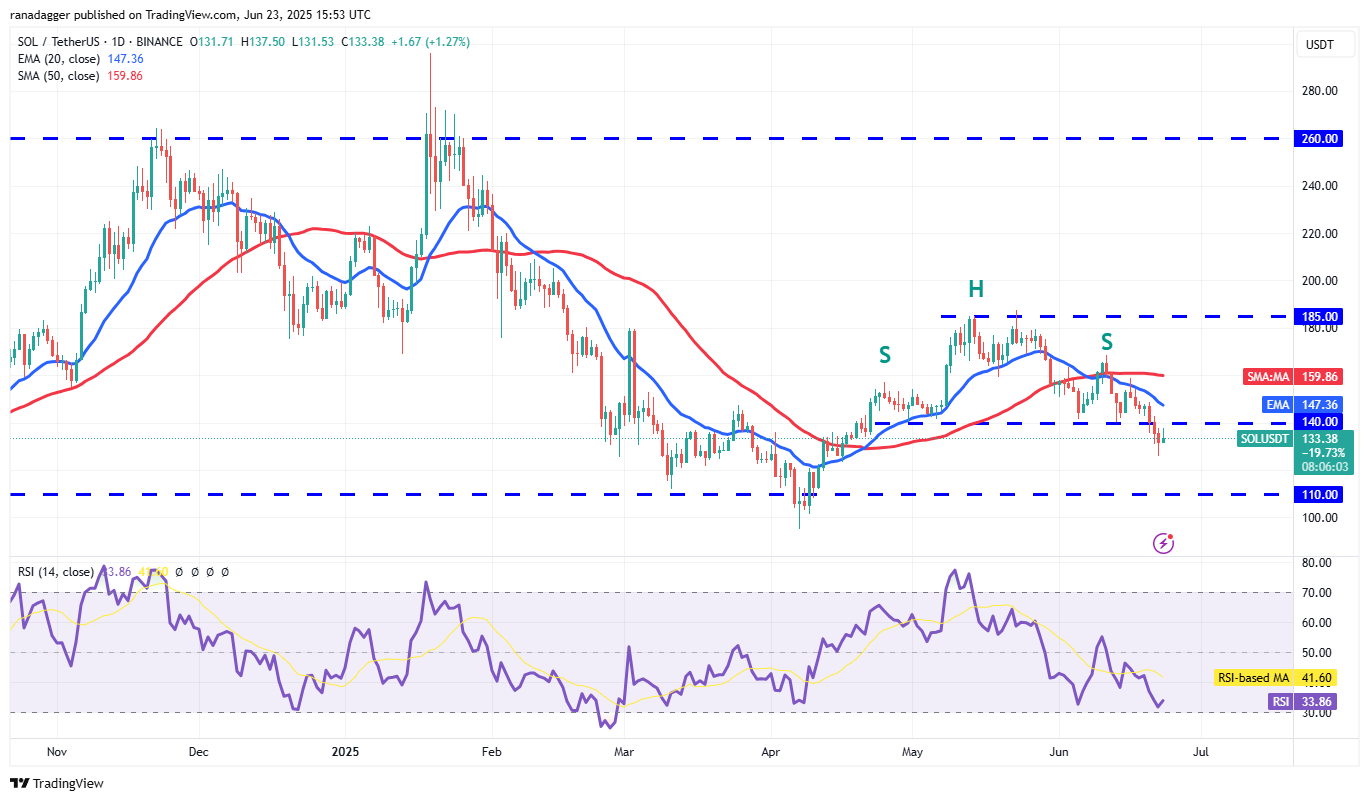
Buyers are trying to start a recovery, which could face selling at the breakdown level of $140 and then at the 20-day EMA ($147). If the price turns down from the overhead zone, the bears will try to resume the downtrend. If the $123 level cracks, the SOL/USDT pair could descend to $110.
Instead, if buyers push the price above the 20-day EMA, it signals solid demand at lower levels. The pair may then rally to the 50-day SMA.
Related: Is XRP price going to crash again?
Dogecoin price prediction
Dogecoin (DOGE) has been oscillating inside a large range between $0.14 and $0.26, indicating buying on dips and selling near the overhead resistance.
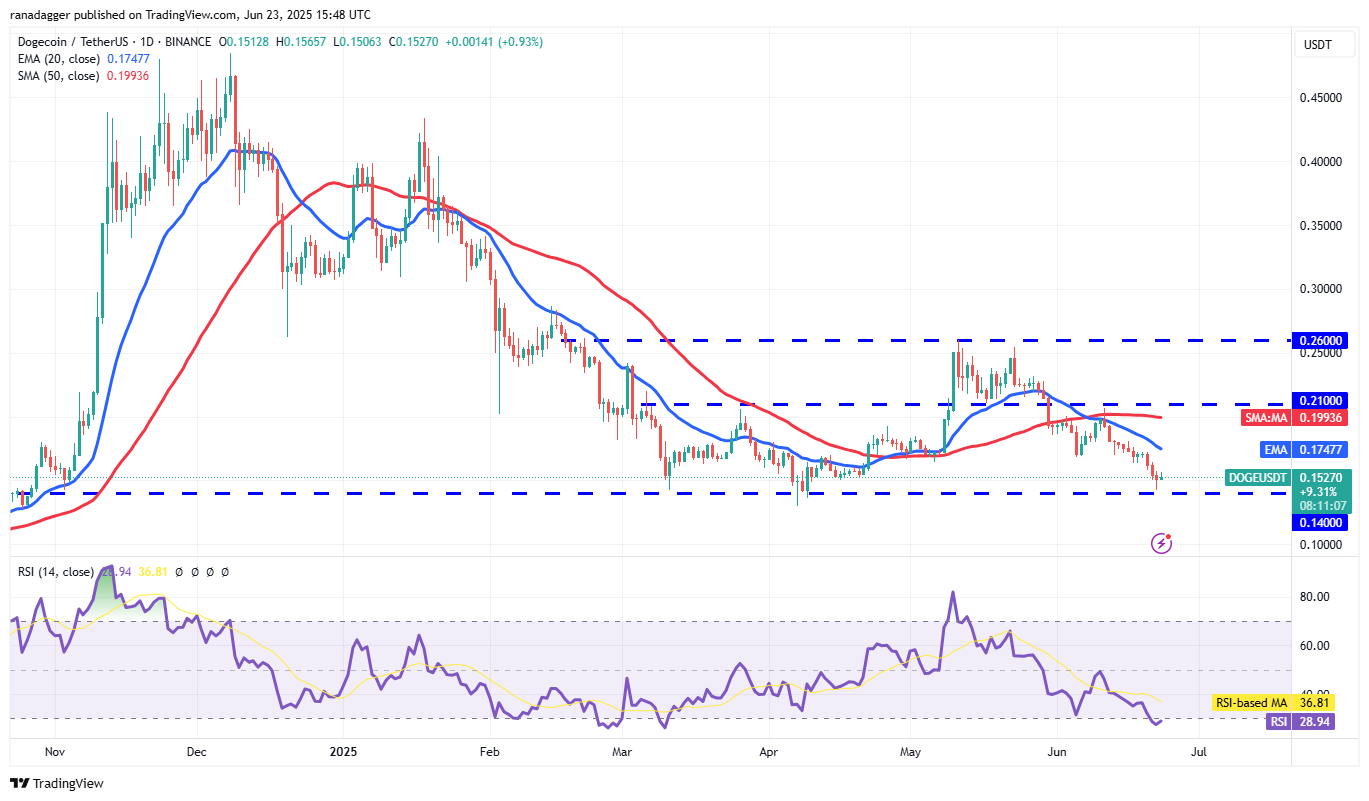
The bulls will try to start a bounce off $0.14, but the relief rally is likely to face strong selling at the 20-day EMA ($0.17). If the price turns down from the 20-day EMA, the bears will again attempt to sink the DOGE/USDT pair below $0.14. If they succeed, the pair could descend to $0.10.
Contrarily, if buyers drive the price above the 20-day EMA, the pair could climb to the 50-day SMA ($0.19). Sellers will try to defend the 50-day SMA and keep the pair inside the $0.14 to $0.21 range for a while.
Cardano price prediction
Cardano (ADA) continued its slide and fell near the $0.50 support on Sunday. Buyers are expected to aggressively defend the $0.50 level, as a break below it will complete a bearish descending triangle pattern.
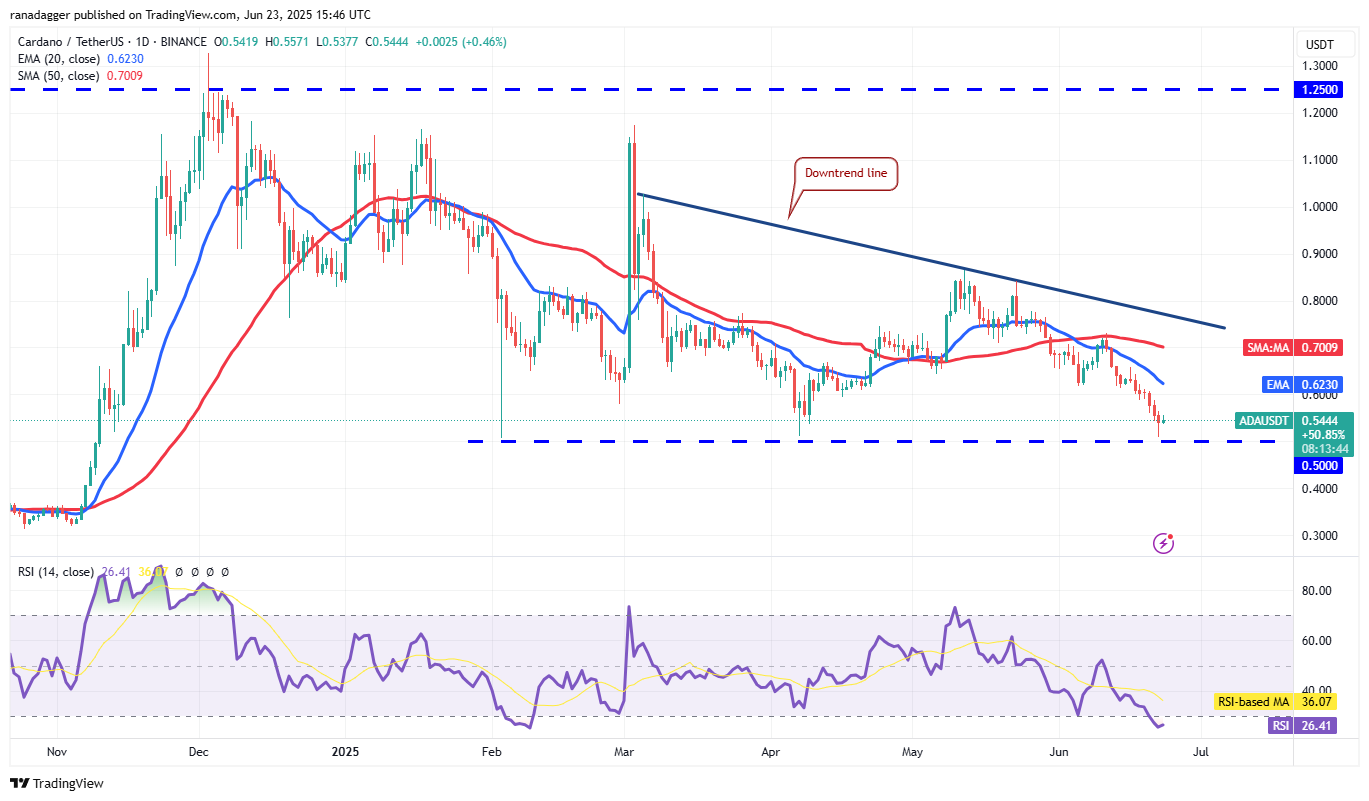
The recovery attempt is likely to face selling at the 20-day EMA ($0.62). If the price turns down sharply from the 20-day EMA, the possibility of a break below the $0.50 support increases. The ADA/USDT pair could then plunge to $0.40.
The first sign of strength will be a close above the 20-day EMA. That suggests the bulls are fiercely protecting the $0.50 level. The pair could rise to the 50-day SMA ($0.70) and later to the downtrend line.
Hyperliquid price prediction
Hyperliquid (HYPE) bounced off the 50-day SMA ($32.63) on Saturday and again on Sunday, indicating solid buying at lower levels.
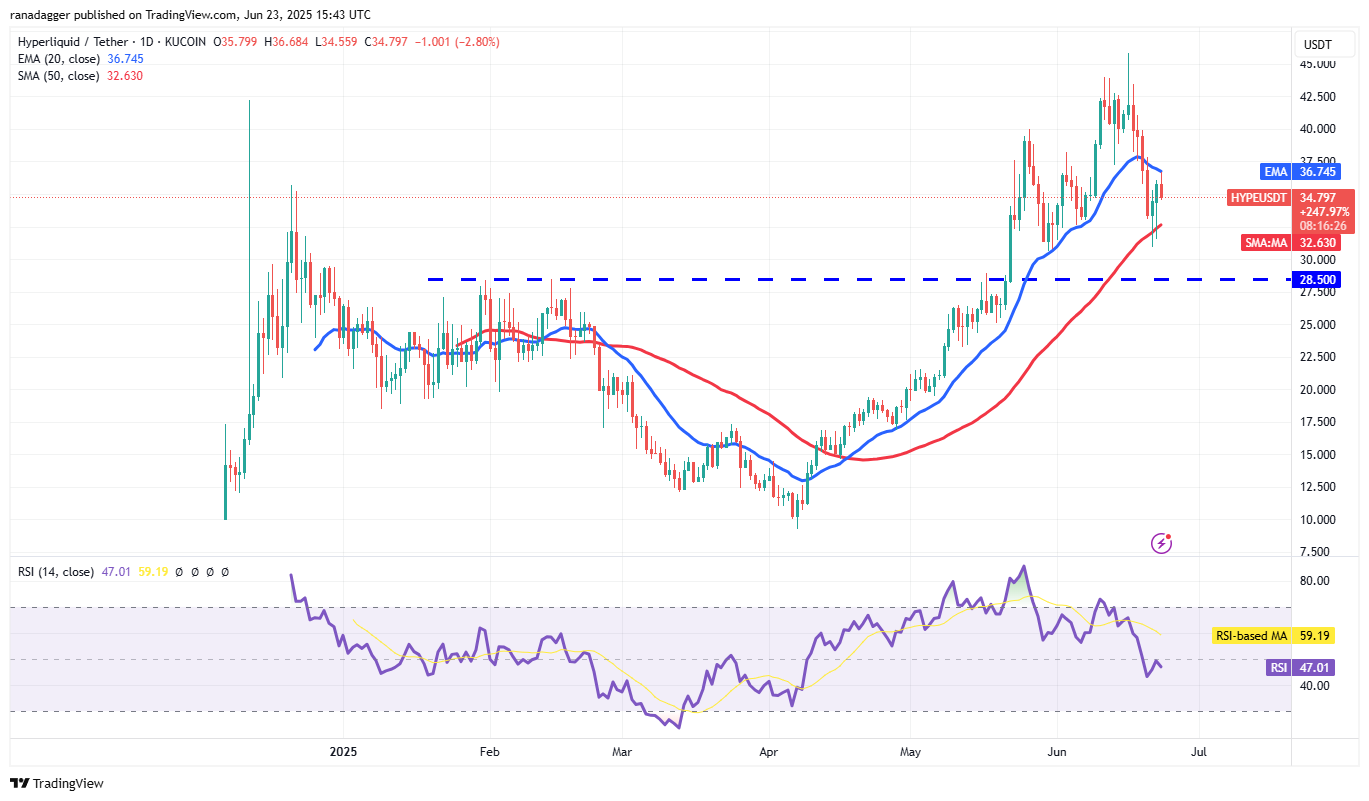
Sellers are trying to retain the advantage by halting the recovery at the 20-day EMA ($36.74). If they manage to do that, the HYPE/USDT pair could retest the strong support at $30.50. Buyers are expected to vigorously defend the $28.50 to $30.50 zone.
On the upside, a break and close above the 20-day EMA suggests the bears are losing their grip. The pair could rise to $40 and subsequently to $42.50. Buyers are likely to face significant resistance in the $42.50 to $45.80 zone.
This article does not contain investment advice or recommendations. Every investment and trading move involves risk, and readers should conduct their own research when making a decision.


