Quick take:
- Timothy Peterson has identified $30k as a possible ‘red alert’ zone for Bitcoin
- At this level, Bitcoin has a higher chance of experiencing a future large crash such as the ones witnessed in 2012, 2014 and 2018
- Bitcoin has broken the $25k, $26k and $27k price ceilings in less than 24 hours
- $28k is a few hundred dollars away for Bitcoin and could be the logical next target
Bitcoin and crypto analyst Timothy Peterson has identified $30k as a ‘red alert’ zone for Bitcoin using his Metcalfe Model. Mr. Peterson shared his analysis via Twitter and explained that Bitcoin breaking this level, would increase its chances of a future large crash similar to those experienced in 2012, 2014 and 2018.
His exact analysis was as follows with a chart highlighting the ‘red zone’ for Bitcoin according to his Metcalfe model.
“Red Alert” would be at $30,000 #Bitcoin. Doesn’t mean sell, just means the risk of a future large crash (2012, ’14, ’18) is nearing 100%.
Bitcoin Breaks $25k – $27k in Less than 24 hours, $28k Could be Next
With respect to price, Bitcoin has had a bullish run beginning Christmas eve when it was trading at around $23,500. Bitcoin has since broken the $24k, $25k, $26k and $27k price ceilings in quick succession with the last three levels accomplished in less than 24 hours.
Bitcoin’s new all-time high is $27,756 – Binance rate. This translates to a 13.3% increment since Christmas Eve and a 12% increment in the last 24 hours.
Bitcoin Has the Weekly, Monthly and Yearly Close Up Ahead
In the next few hours and days, Bitcoin is staring at three important milestones in the form of the weekly close, monthly close and yearly close. The weekly close is tonight, December 27th, and Bitcoin maintaining a value above $20k – $27k is very bullish. Similarly, a high monthly and yearly close at a similar level on the 31st of December will be the highest ever in the history of Bitcoin.
What the daily BTC/USDT chart says
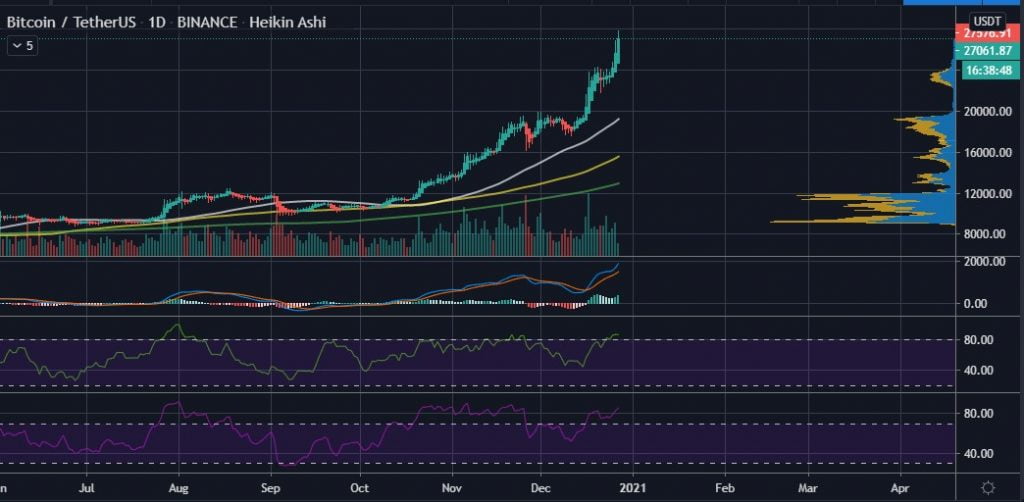
From a technical analysis point of view, Bitcoin is once again in overbought territory as shall be explained via the following daily BTC/USDT chart.
From the chart, the following can be observed
- Bitcoin’s current price at $27,576 is less than $500 away from $28k
- Bitcoin is in parabolic territory as seen through the large deviation from its daily moving averages
- The daily MACD further confirms an overbought situation that is yet to show signs of slowing down
- Trade volume is in the green, albeit reducing
- The daily MFI and RSI are high at 88 and 84 respectively
Summing it up, Bitcoin has once again gone parabolic with $28k looking like the logical next level that BTC will conquer. However, as with all parabolic movements of any asset, Bitcoin risks undergoing a heavy correction in the near future. Bitcoin testing $30k increases the chances of such a correction being a large crash as explained by Timothy Peterson of Cane Island Alternative Advisors.


