

Reason to trust
Strict editorial policy that focuses on accuracy, relevance, and impartiality
Created by industry experts and meticulously reviewed
The highest standards in reporting and publishing
Strict editorial policy that focuses on accuracy, relevance, and impartiality
Morbi pretium leo et nisl aliquam mollis. Quisque arcu lorem, ultricies quis pellentesque nec, ullamcorper eu odio.
Bitcoin’s recent market movement reflects ongoing upward momentum, even as short-term fluctuations suggest some cooling. As of today, BTC trades at $103,485, reflecting a slight 0.6% dip in the last 24 hours and a near 10% decline over the past week.
However, the asset remains just under 5% below its all-time high of $109,000 reached in January, continuing to hold a position near record levels. This pattern suggests Bitcoin may be entering a consolidation phase, supported by long-term bullish fundamentals.
Amid this price performance, renewed activity among long-term holders is generating interest about the sustainability of the current price range and the potential for future volatility.
Related Reading
Bitcoin Binary CDD Signals Potential Market Rotation
CryptoQuant analyst Avocado Onchain recently highlighted a key indicator known as Binary Coin Days Destroyed (CDD), which helps assess the behavior of long-dormant Bitcoin. Binary CDD increases when older coins are moved after extended periods of inactivity, typically a sign of long-term holders re-entering the market or preparing to sell.
Historically, spikes in Binary CDD have coincided with market tops or phases where distribution from early holders to newer market participants increases. According to Avocado, applying a 30-day moving average to Binary CDD smooths the data and provides a clearer view of macro trends.
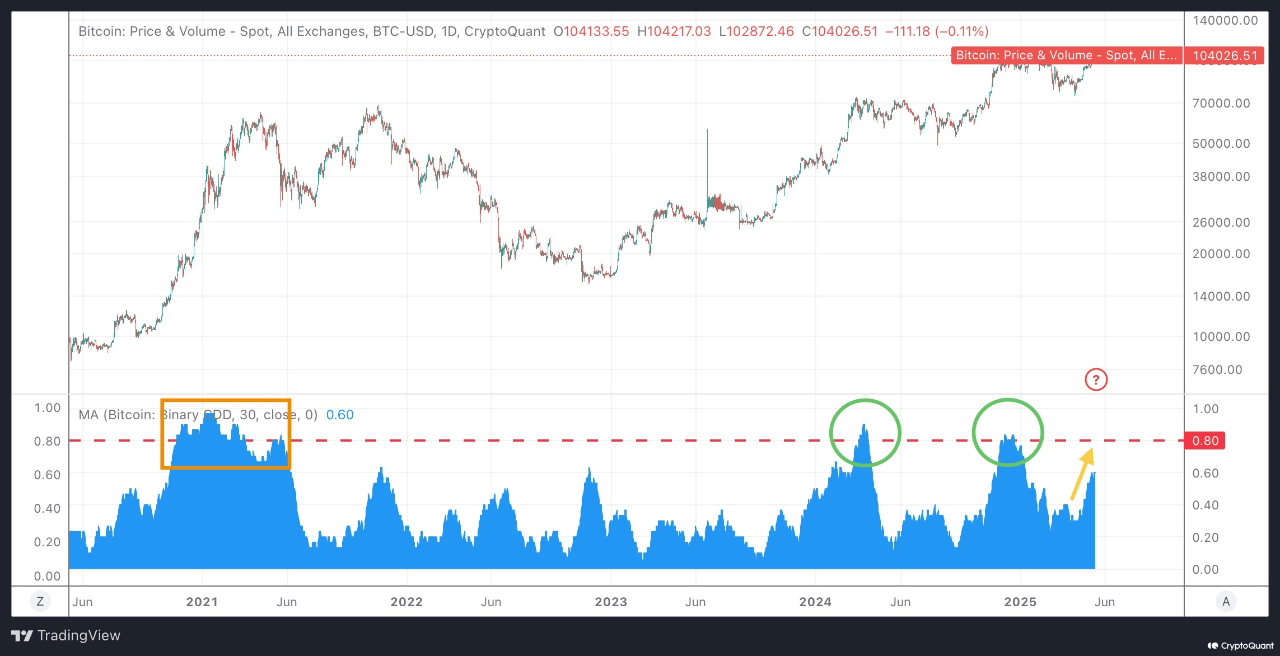
During previous Bitcoin rallies, including in late 2021 and during the twin peaks of 2024, the Binary CDD rose past the 0.8 threshold. That level historically signaled elevated movement from long-term holders, often aligning with increased selling pressure or profit-taking behavior.
Currently, the indicator sits near 0.6 and is trending upward as Bitcoin attempts to retest its highs. If Binary CDD crosses the 0.8 mark again, it may suggest another wave of distribution is underway.
Monitoring Profit Realization Behavior
What makes Binary CDD useful is its ability to reflect potential shifts in market structure. When long-term holders begin moving large volumes of BTC, it often signals the start of profit-taking, especially if accompanied by high prices and strong market sentiment.
However, the indicator alone does not confirm sell-offs; context, such as exchange inflows and broader trading data, is necessary to interpret it fully.
In a broader sense, the current uptick in Binary CDD may point to Bitcoin entering a transitional stage. Rather than signaling the end of an uptrend, it could indicate that notable investors are gradually rotating capital or responding to price action in anticipation of near-term changes.
In a separate market signal, another CryptoQuant analyst, EgyHash, highlighted concerns arising from the Exchange Stablecoins Ratio (USD), a metric that compares Bitcoin reserves to stablecoin holdings on exchanges.
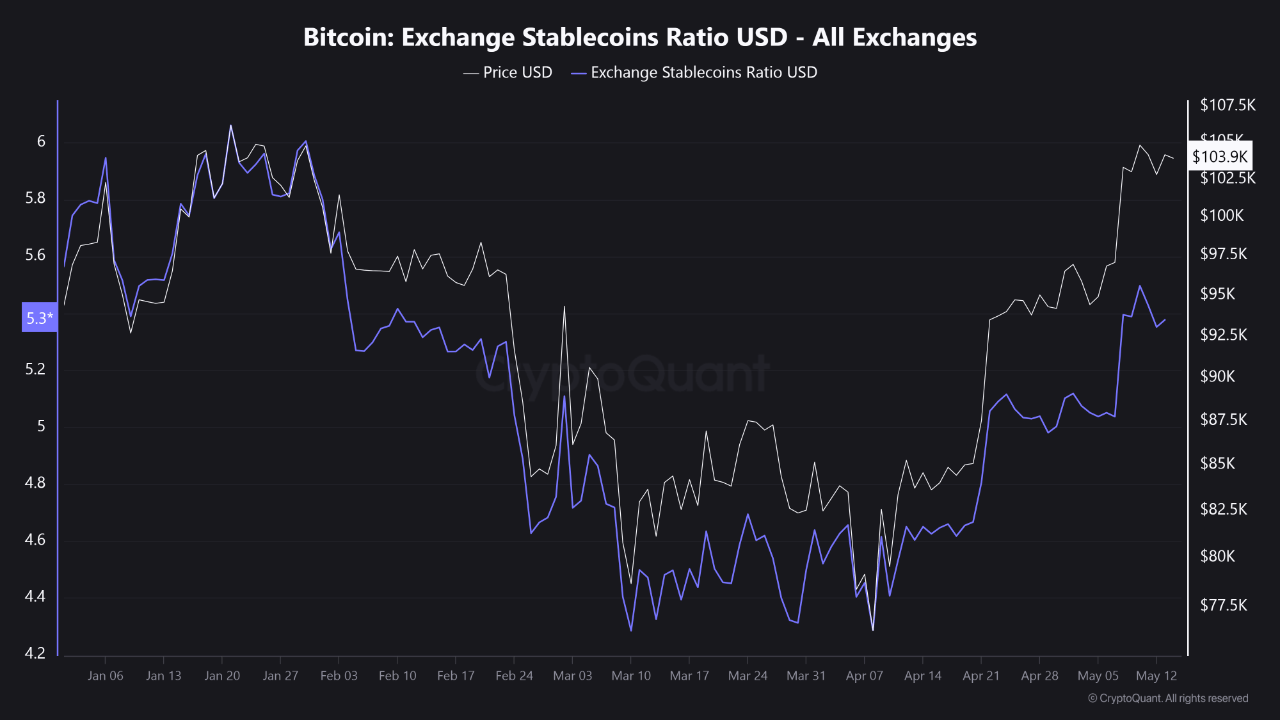
According to EgyHash, this ratio has climbed to around 5.3, surpassing the threshold of 5.0, which previously coincided with distribution phases in the market.
A similar level in late January led to a pullback, and the current reading suggests that more traders may be preparing to sell, possibly rotating BTC holdings back into stablecoins or fiat equivalents.

Featured image created with DALL-E, Chart from TradingView


