WhaleTrades, a Twitterati who tracks the bulky crypto transactions, alerted that a big whale on BitMEX sold $5 million worth of bitcoin at $9,749.69.
BitMEX $BTC Whale:
$5,000,000 worth of #Bitcoin sold at $9,749.69 12:13:43 2020/02/07
| 💰💰💰💰💰💰💰💰💰💰💰💰💰💰💰💰💰💰💰💰 EXIT ALL CRYPTO MARKETS— WhaleTrades 🐳 (@WhaleTrades) February 7, 2020
Minutes before the big sell order, Bitcoin had soared above $9,890 to establish a new year-to-date high. However, the rally fizzled within minutes to near $9,737, leaving traders under the impression of a pump and dump behavior.
Full-time trader Salsa Tekila warned about a potential bitcoin flash crash shortly after noticing a long candle wick formation on short-term charts. The analyst said he was exiting all his bitcoin positions because of the “risk of [a] flash dump.”
/7 New yearly highs got sold hard into, I was greedy and didn’t close where I should’ve (9880$).
I’m fully out, risk of flashdump too high from here.$BTC pic.twitter.com/ii5yDBhBJO
— SalsaTekila (JUL) (@SalsaTekila) February 7, 2020
Bitcoin’s $150 crash from $9,890 triggered similar bearish calls from other traders. TraderMJ, for instance, confirmed that he was taking liquidity on the possibility of a volatile price reversal. The trader added that he is not going to open any fresh short position, believing that the market is still in an uptrend.
“Not shorting, because I don’t do that in an uptrend, but tethering up and bit and looking to buy back at either 9700 or 9500 ( preferably 9500),” tweeted TraderMJ.
A Small Bounce Underway
The BitMEX XBT/USD 15M chart showed the pair attempting a bounce-back. The price pulled back from the intraday low of $9,737, albeit weakly, leaving an impression of an extended bearish correction as the session matures.
Bitcoin hinting a breakdown as dumping sentiment grows | Source: TradingView.com, BitMEX
So it appears, bitcoin is trending inside a near-term Ascending Channel, now testing its lower trendline as support. A bounce-back from here could show traders’ likelihood of continuing the uptrend. On the other hand, a breakdown could spill fears of a price crash towards the blued 200-period moving average (at around $9,687).
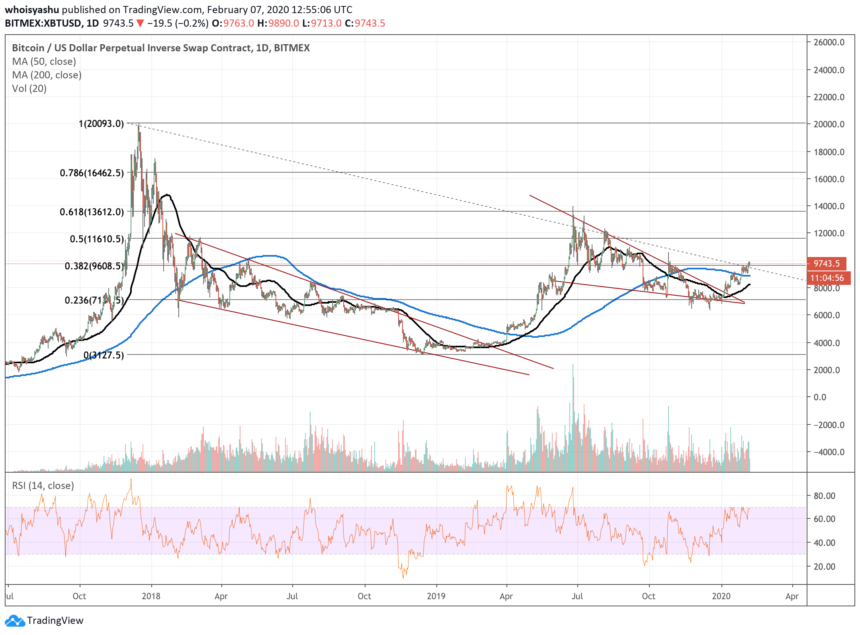
The daily chart, on the other hand, preserved bitcoin’s bullish bias. The price weakened but maintained above a key support level defined by $9,608 – the 36.8% Fibonacci retracement level measured from a swing high of $20k to low of $3.2k.
This story is being updated.


